. 2009 Sep 4;138(5):1019-31.
doi: 10.1016/j.cell.2009.06.049. Epub 2009 Aug 20.

Genome-wide mapping of HATs and HDACs reveals distinct functions in active and inactive genes

Affiliations

Genome-wide mapping of HATs and HDACs reveals distinct functions in active and inactive genes

Zhibin Wang et al. Cell. .

Abstract

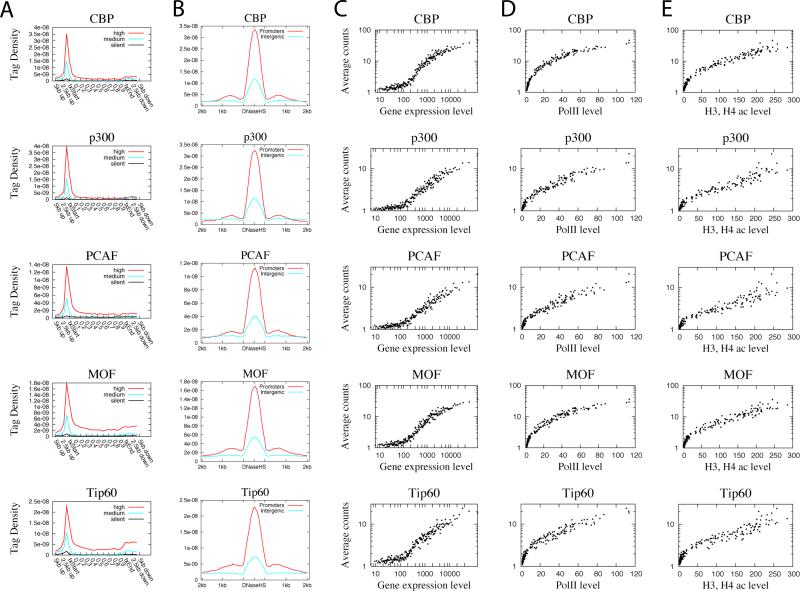
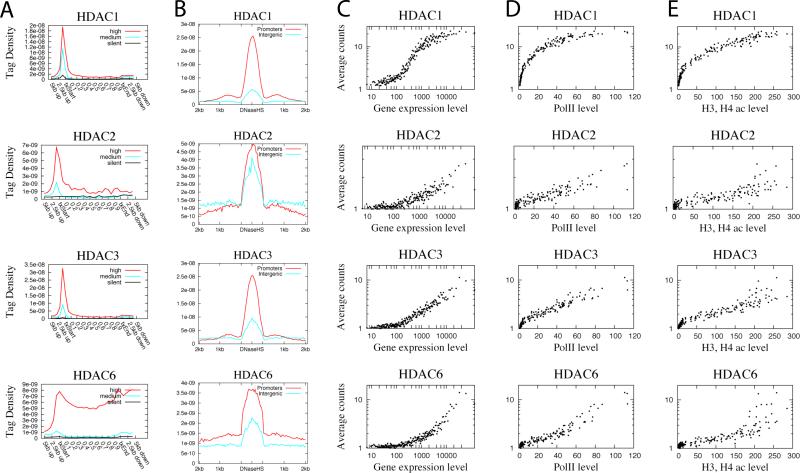
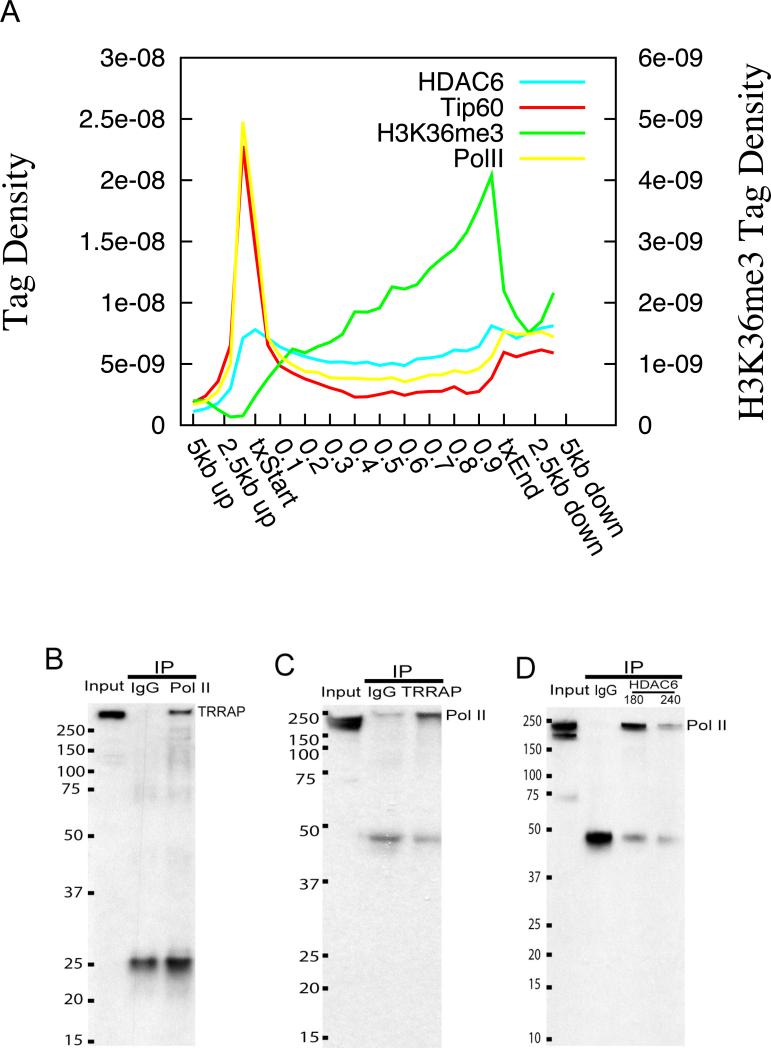
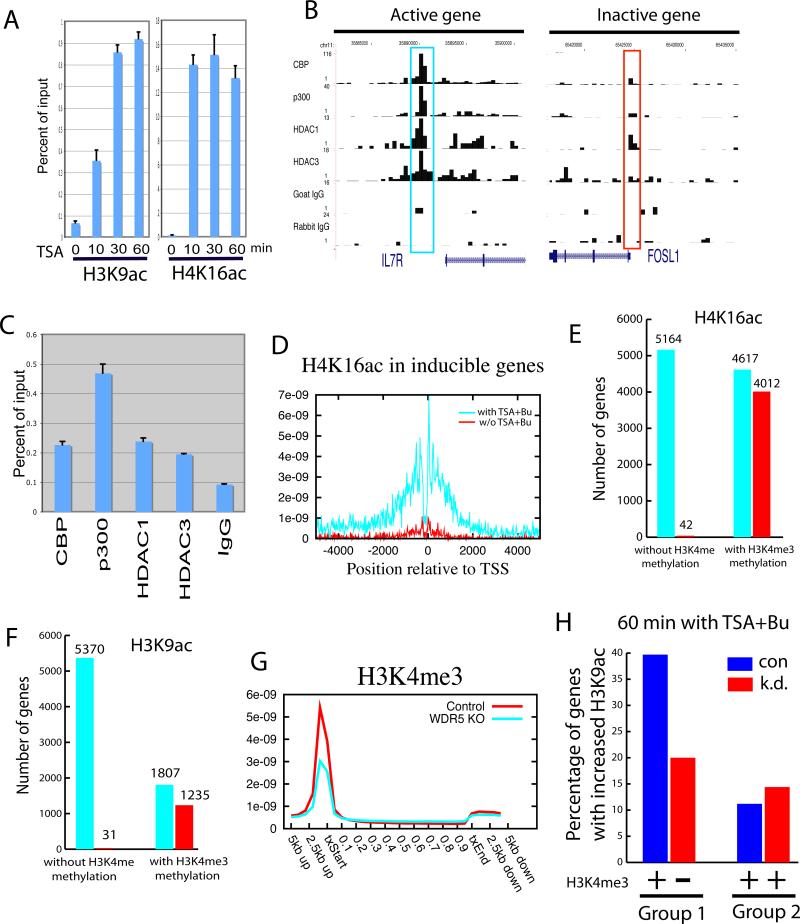
Histone acetyltransferases (HATs) and deacetylases (HDACs) function antagonistically to control histone acetylation. As acetylation is a histone mark for active transcription, HATs have been associated with active and HDACs with inactive genes. We describe here genome-wide mapping of HATs and HDACs binding on chromatin and find that both are found at active genes with acetylated histones. Our data provide evidence that HATs and HDACs are both targeted to transcribed regions of active genes by phosphorylated RNA Pol II. Furthermore, the majority of HDACs in the human genome function to reset chromatin by removing acetylation at active genes. Inactive genes that are primed by MLL-mediated histone H3K4 methylation are subject to a dynamic cycle of acetylation and deacetylation by transient HAT/HDAC binding, preventing Pol II from binding to these genes but poising them for future activation. Silent genes without any H3K4 methylation signal show no evidence of being bound by HDACs.


Figures

Figure 1
Figure 1. All HATs are correlated with gene expression, Pol II and acetylation levels
A. Profiles of HATs binding across 5’ gene ends, 3’ gene ends and gene body regions of the 1000 most active, intermediately active and least active genes were examined using ChIP-Seq. txStart: transcription start site. txEnd: transcription end site. B. Profiles of HATs binding across intergenic (5kb away from any gene) or promoter (defined as +/− 1kb surrounding TSS) DNase HS sites. DNase HS sites were obtained from (Boyle et al., 2008). C. Correlation between HAT binding and gene expression levels. Genes were grouped to 100 gene (one dot in the figure) sets according to expression level. The HAT binding level in promoter region was calculated for the same 100 gene sets. The y-axis indicates the HAT binding level and the x-axis indicates the expression level. D. Correlation between HAT binding and RNA Pol II binding levels among the 100 gene sets grouped according to expression levels as defined in panel C. The y-axis indicates the HAT binding level and the x-axis indicates the Pol II level. E. Correlation between HAT binding and histone acetylation levels among the 100 gene sets grouped according to expression levels as defined in panel C. The acetylation level was calculated by pooling all reads for 18 histone acetylations mapped previously (Wang et al., 2008). The y-axis indicates the HAT binding level and the x-axis indicates the acetylation level.
Figure 2
Figure 2. HDACs are positively correlated with gene expression, Pol II binding and acetylation levels
A. Profiles of HDAC binding across 5’ gene ends, 3’ gene ends and gene body regions of 1000 most active, intermediately active and silent genes. B. Profiles of HDAC binding across intergenic or promoter DNase HS sites. C. Correlation between HAT binding and gene expression levels. See Figure 1C for details. D. Correlation between HAT binding and RNA Pol II binding levels. See Figure 1D for details. E. Correlation between HAT binding and histone acetylation levels. See Figure 1E for details.
Figure 3
Figure 3. Tip60 and HDAC6 are recruited to active genes through interaction with phosphorylated RNA Polymerase II
A. Distribution profiles of HDAC6, Tip60, Pol II and H3K36me3 across the active genes were plotted. The left y-axis indicates tag densities for HDAC6, Tip60 and Pol II. The right axis indicates tag densities for H3K36me3. B. Co-immunoprecipitation of TRRAP with RNA Pol II. Nuclear extracts (Input) and immunoprecipitates using control IgG or Pol II antibodies were resolved by SDS-PAGE and blotted with antibodies against TRRAP. The size markers are indicated on the left of the panel. The band corresponding to TRRAP is indicated on the right. C. Co-immunoprecipitation of phosphorylated RNA Pol II with TRRAP. The band corresponding to phosphorylated Pol II is indicated on the right. D. Co-immunoprecipitation of phosphorylated RNA Pol II with HDAC6. The band corresponding to phosphorylated Pol II is indicated on the right.
Figure 4
Figure 4. Recruitment of Tip60 and HDAC6 by TCR signaling is correlated with the recruitment of RNA Pol II
A-C: The changes in Pol II, Tip60 and HDAC6 binding after TCR signaling determined using ChIP-Seq (y-axis) are plotted against the changes in expression levels (x-axis). Genes were grouped to 100 gene set as one dot in the figure. D, E: The changes in Tip60 and HDAC6 binding levels after TCR signaling are plotted against the changes in Pol II binding level.
Figure 5
Figure 5. Inhibition of HDAC activities leads to further increases of acetylation levels in active genes
A. HDAC inhibitor treatment causes remarkable increases in histone acetylation in active genes. Resting T cells were treated with TSA and Butyrate and the distribution of H3K9ac and H4K16ac was analyzed using ChIP-Seq. The acetylation pattern of the CD4 locus is shown as custom tracks on the UCSC genome browser. TSA+Bu: the cells were treated with TSA and Butyrate. B. Pol II is highly enriched in the promoter and downstream of TSSs of active genes. The profiles of Pol II binding surrounding TSSs are shown for active, intermediately active and silent genes. C. HDAC6 II is highly enriched in the promoter and downstream of TSSs of active genes. The profiles of Pol II binding surrounding TSSs are shown for active, intermediately active and silent genes. D. The most increase in H3K9 acetylation is detected in the promoter and downstream of TSSs of active genes. Act:0h, Act:2h, Sil:0h, and Sil:2h: the normalized acetylation levels of the active genes and silent genes with TSA treatment (2 hrs) or no treatment (0 hr). E. The most increase in H4K16 acetylation is detected in the promoter and downstream of TSSs of active genes.
Figure 6
Figure 6. HATS and HDACs function at silent genes primed by H3K4 methylation
A. Rapid increase of histone acetylation in silent genes caused by HDAC inhibitor treatment. ChIP assays were performed using H3K9ac and H4K16ac antibodies with chromatin from cells treated in the absence or presence of HDAC inhibitors. The ChIP DNA was analyzed using qPCR. B. The ChIP-Seq signals for the DIPA gene (active) and FOSL1 gene (silent) were displayed. The signals highlighted in blue are not statistically significant as determined using peak-finding programs. C. qPCR assays revealed low but reproducible binding of HATs and HDACs in the silent FOSL1 promoter (see Panel B). D. H4K16ac was strongly elevated in the TCR-inducible genes by TSA + Butyrate treatment. H4K16 acetylation was profiled using ChIP-Seq in resting T cells in the presence or absence of TSA + Butyrate treatment. The H4K16ac profiles were plotted for the 167 silent genes that are induced by TCR signaling. E. The presence of H3K4 methylation indicates the potential of histone H4K16 acetylation. All genes (9,781) not associated with H4K16ac were separated into the genes with H3K4 methylation (5,164) and those without (4,617). The number of genes that became acetylated with the HDAC inhibitor treatment was examined for each group (shown by the red bar). F. The presence of H3K4 methylation indicates the potential of histone H3K9 acetylation. All genes (7,177) not associated with H3K9ac were grouped and analyzed similarly as in Panel E. The number of genes that became acetylated are shown by the red bar. G. Knock-down of WDR5 decreased H3K4me3 signals in the promoter regions. H3K4me3 distribution in wild type and Knock-down cells were determined using ChIP-Seq and the profiles were analyzed as in Figure 1. H. Inhibition of H3K4me3 modification decreased H3K9ac with the HDAC inhibitor Treatment. H3K4me3 and H3K9ac profiles were analyzed in the control (con) and WDR5 knockdown (k.d.) cells. Group 1 genes lost H3K4me3 signals in the knockdown cells; Group 2 genes did not show significant decrease in H3K4me3 signals in the knockdown cells. y-axis indicates the percentage of genes that showed an increase of at least 2-fold in H3K9ac with the HDAC inhibitor treatment in both of these two gene groups.
Figure 7
Figure 7. HDACs inhibit Pol II binding to the promoters primed by H3K4 methylation
A. Promoters primed by H3K4 methylation become bound by Pol II following HDAC inhibitor treatment. Pol II binding levels were calculated by normalizing the Pol II ChIP-Seq sequence reads in the promoter regions with the number of promoters. B. HDAC inhibitor treatment induces Pol II binding to the LMO4 promoter that was primed by prior H3K4 methylation. C. High levels of both HATs and HDACs are associated with active genes. HDACs function to reset chromatin by removing acetyl groups added by HATs recruited by elongating Pol II. D. Low levels of both HATs and HDACs are associated with inactive genes primed by H3K4 methylation. HDACs function to repress transcription by preventing Pol II binding by removing acetyl groups added by transient binding of HATs. E. No detectible levels of either HATs or HDACs are associated with silent genes devoid of any significant H3K4 methylation.

References

    1. Barski A, Cuddapah S, Cui K, Roh TY, Schones DE, Wang Z, Wei G, Chepelev I, Zhao K. High-resolution profiling of histone methylations in the human genome. Cell. 2007;129:823–837. - PubMed
    1. Berger SL. The complex language of chromatin regulation during transcription. Nature. 2007;447:407–412. - PubMed
    1. Boeger H, Griesenbeck J, Strattan JS, Kornberg RD. Nucleosomes unfold completely at a transcriptionally active promoter. Mol Cell. 2003;11:1587–1598. - PubMed
    1. Boyault C, Sadoul K, Pabion M, Khochbin S. HDAC6, at the crossroads between cytoskeleton and cell signaling by acetylation and ubiquitination. Oncogene. 2007;26:5468–5476. - PubMed
    1. Boyle AP, Davis S, Shulha HP, Meltzer P, Margulies EH, Weng Z, Furey TS, Crawford GE. High-resolution mapping and characterization of open chromatin across the genome. Cell. 2008;132:311–322. - PMC - PubMed

Publication types

Associated data