

Live-cell imaging of aquaporin-4 diffusion and interactions in orthogonal arrays of particles
- PMID: 19699275
- PMCID: PMC3586212
- DOI: 10.1016/j.neuroscience.2009.08.034
Live-cell imaging of aquaporin-4 diffusion and interactions in orthogonal arrays of particles
Abstract
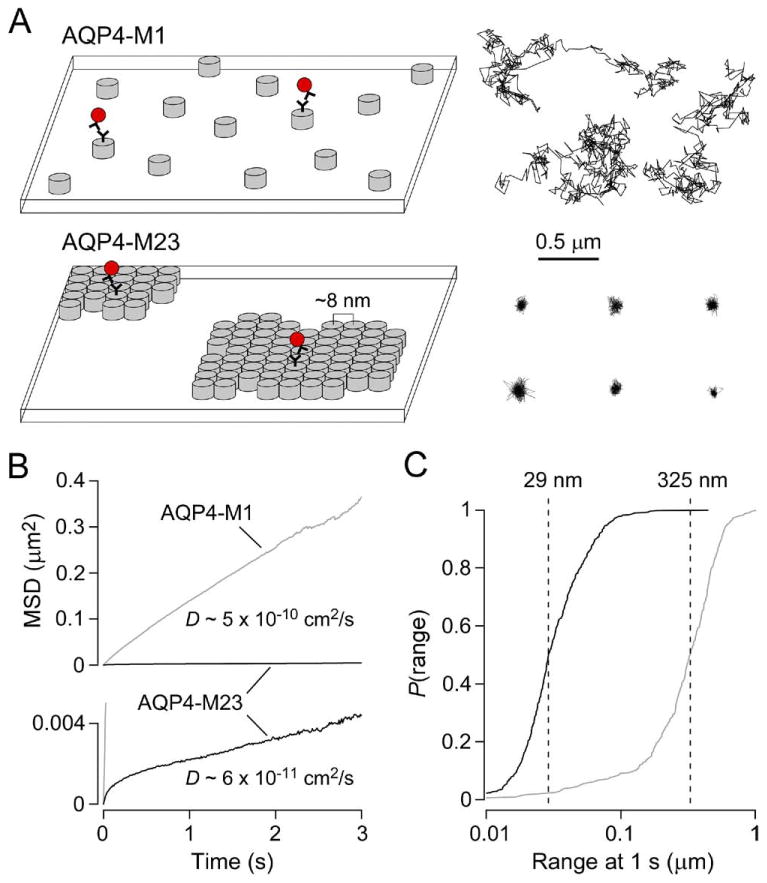
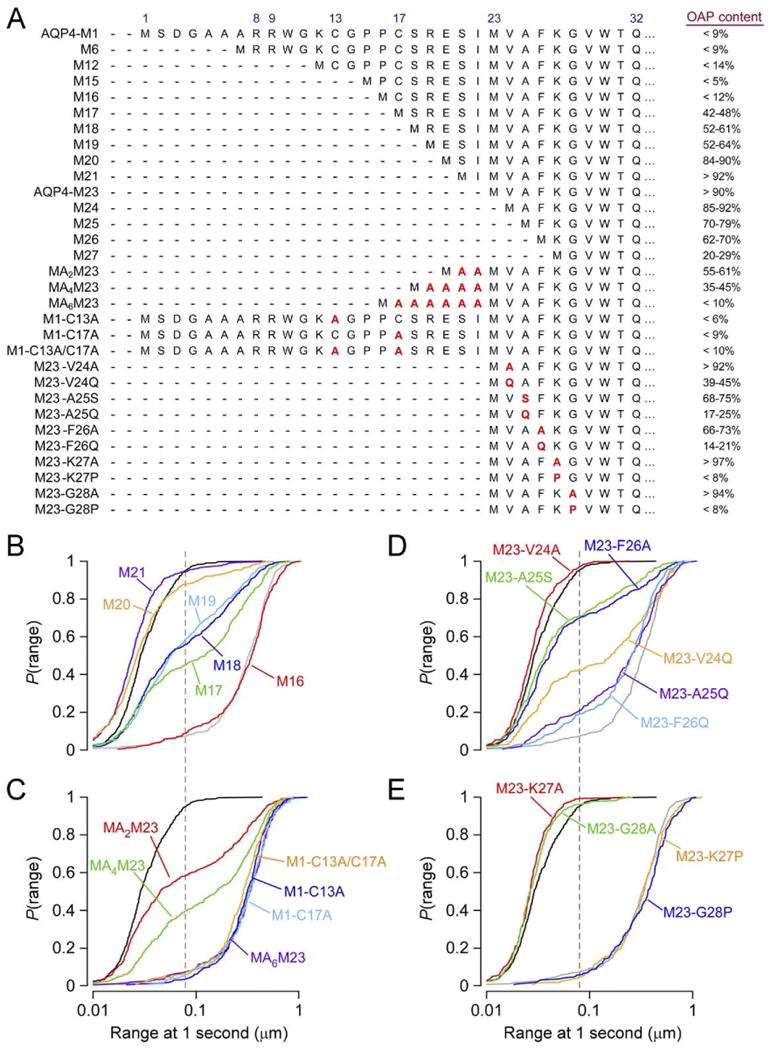
Orthogonal arrays of particles (OAPs) have been visualized for many years by freeze-fracture electron microscopy. Our laboratory discovered that aquaporin-4 (AQP4) is the protein responsible for OAP formation by demonstrating OAPs in AQP4-transfected cells and absence of OAPs in AQP4 knockout mice. We recently developed live-cell, single-molecule imaging methods to study AQP4 diffusion and interactions in OAPs. The methods include single particle tracking of quantum-dot labeled AQP4, and total internal reflection fluorescence microscopy of green fluorescent protein (GFP) and small fluorophore-labeled AQP4. The full-length (M1) form of AQP4 diffuses freely in membranes and does not form OAPs, whereas the shorter (M23) form of AQP4 forms OAPs and is nearly immobile. Analysis of a series of AQP4 truncations, point mutants and chimeras revealed that OAP formation by AQP4-M23 is stabilized by hydrophobic tetramer-tetramer interactions involving N-terminus residues, and that absence of OAPs in AQP4-M1 results from blocking of this interaction by residues just upstream from Met23. These biophysical methods are being extended to identify the cellular site of AQP4 assembly, AQP4 isoform interactions, OAP size and dynamics, and the determinants of regulated OAP assembly.
Copyright (c) 2010 IBRO. Published by Elsevier Ltd. All rights reserved.
Figures


Similar articles
-
Determinants of aquaporin-4 assembly in orthogonal arrays revealed by live-cell single-molecule fluorescence imaging.J Cell Sci. 2009 Mar 15;122(Pt 6):813-21. doi: 10.1242/jcs.042341. Epub 2009 Feb 24. J Cell Sci. 2009. PMID: 19240114 Free PMC article.
-
Live cell analysis of aquaporin-4 m1/m23 interactions and regulated orthogonal array assembly in glial cells.J Biol Chem. 2009 Dec 18;284(51):35850-60. doi: 10.1074/jbc.M109.071670. J Biol Chem. 2009. PMID: 19843522 Free PMC article.
-
Reversible, temperature-dependent supramolecular assembly of aquaporin-4 orthogonal arrays in live cell membranes.Biophys J. 2009 Dec 2;97(11):3010-8. doi: 10.1016/j.bpj.2009.09.017. Biophys J. 2009. PMID: 19948131 Free PMC article.
-
Live-cell imaging of aquaporin-4 supramolecular assembly and diffusion.Methods Enzymol. 2012;504:341-54. doi: 10.1016/B978-0-12-391857-4.00017-3. Methods Enzymol. 2012. PMID: 22264543 Free PMC article. Review.
-
Structure and functions of aquaporin-4-based orthogonal arrays of particles.Int Rev Cell Mol Biol. 2011;287:1-41. doi: 10.1016/B978-0-12-386043-9.00001-3. Int Rev Cell Mol Biol. 2011. PMID: 21414585 Review.
Cited by
-
Is Upregulation of Aquaporin 4-M1 Isoform Responsible for the Loss of Typical Orthogonal Arrays of Particles in Astrocytomas?Int J Mol Sci. 2016 Jul 29;17(8):1230. doi: 10.3390/ijms17081230. Int J Mol Sci. 2016. PMID: 27483250 Free PMC article.
-
Aquaporin 4-specific T cells in neuromyelitis optica exhibit a Th17 bias and recognize Clostridium ABC transporter.Ann Neurol. 2012 Jul;72(1):53-64. doi: 10.1002/ana.23651. Epub 2012 Jul 17. Ann Neurol. 2012. PMID: 22807325 Free PMC article.
-
New insights into neuromyelitis optica.J Clin Neurol. 2011 Sep;7(3):115-27. doi: 10.3988/jcn.2011.7.3.115. Epub 2011 Sep 29. J Clin Neurol. 2011. PMID: 22087205 Free PMC article.
-
Knockdown of RUNX2 Attenuated A1 Astrocyte Overactivation, Brain Injury, and Cerebral Edema During Ischemic Stroke.Neuromolecular Med. 2025 Jun 27;27(1):48. doi: 10.1007/s12017-025-08868-8. Neuromolecular Med. 2025. PMID: 40576866
-
Molecular outcomes of neuromyelitis optica (NMO)-IgG binding to aquaporin-4 in astrocytes.Proc Natl Acad Sci U S A. 2012 Jan 24;109(4):1245-50. doi: 10.1073/pnas.1109980108. Epub 2011 Nov 29. Proc Natl Acad Sci U S A. 2012. PMID: 22128336 Free PMC article.
References
-
- Amiry-Moghaddam M, Otsuka T, Hurn PD, Traystman RJ, Haug FM, Froehner SC, Adams ME, Neely JD, Agre P, Ottersen OP, Bhardwaj A. An alpha-syntrophin-dependent pool of AQP4 in astroglial end-feet confers bidirectional water flow between blood and brain. Proc Natl Acad Sci U S A. 2003;100:2106–2111. - PMC - PubMed
-
- Auguste KI, Jin S, Uchida K, Yan D, Manley GT, Papadopoulos MC, Verkman AS. Greatly impaired migration of implanted aqua-porin-4-deficient astroglial cells in mouse brain toward a site of injury. FASEB J. 2007;21:108–116. - PubMed
-
- Binder DK, Yao X, Zador Z, Sick TJ, Verkman AS, Manley GT. Increased seizure duration and slowed potassium kinetics in mice lacking aquaporin-4 water channels. Glia. 2006;53:631–636. - PubMed
-
- Bloch O, Auguste KI, Manley GT, Verkman AS. Accelerated progression of kaolin-induced hydrocephalus in aquaporin-4-deficient mice. J Cereb Blood Flow Metab. 2006;26:1527–1537. - PubMed
Publication types
MeSH terms
Substances
Grants and funding
- HL73856/HL/NHLBI NIH HHS/United States
- R01 EY013574/EY/NEI NIH HHS/United States
- R01 EB000415/EB/NIBIB NIH HHS/United States
- R01 DK035124/DK/NIDDK NIH HHS/United States
- EY13574/EY/NEI NIH HHS/United States
- DK35124/DK/NIDDK NIH HHS/United States
- EB00415/EB/NIBIB NIH HHS/United States
- HL59198/HL/NHLBI NIH HHS/United States
- R01 HL073856/HL/NHLBI NIH HHS/United States
- P30 DK072517/DK/NIDDK NIH HHS/United States
- DK72517/DK/NIDDK NIH HHS/United States
- R01 HL059198/HL/NHLBI NIH HHS/United States
- R37 DK035124/DK/NIDDK NIH HHS/United States
- R37 EB000415/EB/NIBIB NIH HHS/United States
LinkOut - more resources
Full Text Sources
