. 2009 Nov;257(1-2):63-74.
doi: 10.1016/j.heares.2009.08.005. Epub 2009 Aug 20.

The auditory midbrain of people with tinnitus: abnormal sound-evoked activity revisited

Affiliations

The auditory midbrain of people with tinnitus: abnormal sound-evoked activity revisited

Jennifer R Melcher et al. Hear Res. 2009 Nov.

Abstract

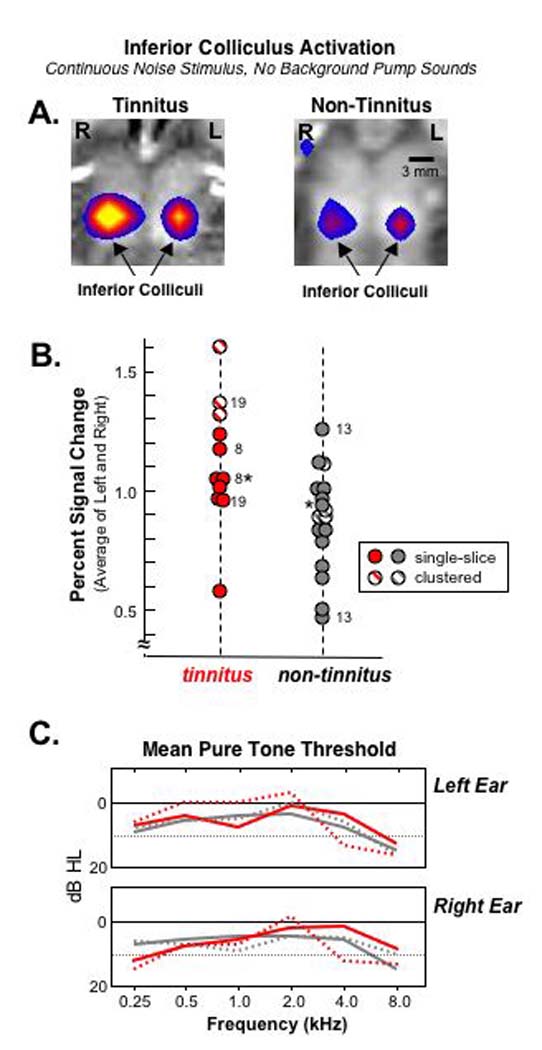
Sound-evoked fMRI activation of the inferior colliculi (IC) was compared between tinnitus and non-tinnitus subjects matched in threshold (normal), age, depression, and anxiety. Subjects were stimulated with broadband sound in an "on/off" fMRI paradigm with and without on-going sound from the scanner coolant pump. (1) With pump sounds off, the tinnitus group showed greater stimulus-evoked activation of the IC than the non-tinnitus group, suggesting abnormal gain within the auditory pathway of tinnitus subjects. (2) Having pump sounds on reduced activation in the tinnitus, but not the non-tinnitus group. This result suggests response saturation in tinnitus subjects, possibly occurring because abnormal gain increased response amplitude to an upper limit. (3) In contrast to Melcher et al. (2000), the ratio of activation between right and left IC did not differ significantly between tinnitus and non-tinnitus subjects or in a manner dependent on tinnitus laterality. However, new data from subjects imaged previously by Melcher et al. suggest a possible tinnitus subgroup with abnormally asymmetric function of the IC. The present and previous data together suggest elevated responses to sound in the IC are common among those with tinnitus and normal thresholds, while abnormally asymmetric activation is not, even among those with lateralized tinnitus.


Figures

Figure 1
Figure 1
Spectrum of sound produced by the coolant pump measured in the two scanners used in this study: 1.5 T Siemens Sonata (black curve) and 3 T Siemens Trio (gray). The measurement of coolant pump sound was made from a microphone positioned where a subject’s ear would be during scanning. The attenuation provided by the earmuffs worn by subjects has not been taken into account. In both scanners, the sound from the coolant pump varied in amplitude cyclically with a period of 0.83 s. The spectra were calculated over one period. The methods for measuring and analyzing the scanner pump sounds are given in Ravicz et al., 2000.
Figure 2
Figure 2
The inferior colliculi of tinnitus subjects showed abnormally high sound-evoked activation when the scanner coolant pump (and the acoustic noise it produces) was off. The sound stimulus was continuous, broadband noise (binaural, 50–55 dB SL). A: Enlarged images of the inferior colliculi in one tinnitus and one non-tinnitus subject (corresponding to circles near asterisks in (B)). A map of activation (color) produced by the continuous noise stimulus is overlaid on a T1-weighted anatomical image (grayscale) obtained in the same imaging session. The color scale in the activation maps indicates the significance of the difference in image signal between stimulus on and off periods according to a t-test (uncorrected for multiple comparisons) (blue: p = 0.01; yellow: 2 × 10⁻⁹). Both the activation maps (in-plane resolution of 3.1 × 3.1 mm) and the anatomical images (1.5 × 1.5 mm) have been interpolated for these displays. B: Percent signal change in the inferior colliculi of each tinnitus and non-tinnitus subject studied during the “pump off” condition. Each circle indicates percent change averaged between the left and right inferior colliculi of a given subject. Data taken with single-slice and clustered acquisition are represented by solid and diagonally-shaded circles, respectively. For the three subjects imaged twice (8, 13, 19), data are plotted separately for the two sessions. Overlapping circles have been displaced horizontally so they can be seen. C: Mean pure tone thresholds for the tinnitus and non-tinnitus subjects in (B). The mean is shown separately for subjects imaged with single-slice (solid lines) and clustered (dotted lines) acquisition. Subjects imaged twice with single-slice acquisition (8, 13) are included once in the averages. The one subject imaged with both single-slice and clustered acquisition (19) is included in both averages.
Figure 3
Figure 3
The addition of pump sounds to the acoustic environment usually reduced stimulus-evoked activation in tinnitus subjects (left) but not in non-tinnitus subjects (right). Circles indicate percent signal change in the inferior colliculi (average of left and right) measured with the pump off (left in each panel) or on (right). Each pair of circles joined by a line corresponds to a given subject. The joining line is black when activation was reduced during the pump on condition. It is gray when activation was increased or did not change. The circles are black for subjects with normal hearing thresholds and gray-filled for the two tinnitus subjects with high-frequency hearing loss. One tinnitus subject studied with both single-slice and clustered acquisition is represented twice in this figure, but was represented only once (by the average) in calculating the statistical results in the text.
Figure 4
Figure 4
Activation ratio in the midbrain of individual subjects in the present study (left: pump off; middle: pump on) and in the previous Melcher et al. studies (right; only subjects meeting the audiometric criteria of the present study are included). Each point indicates percent signal change in the right inferior colliculus divided by that in the left for a given subject and test session. Numbers next to some of the data points label the data for the four subjects studied both here and by Melcher et al. (8, 13, 16, 19). Data obtained using single-slice and clustered acquisition are indicated by filled and diagonally-shaded circles, respectively.
Figure 5
Figure 5
An hypothesis explaining the two main results of the present study: (1) elevated fMRI activation to a sound stimulus in tinnitus subjects, (2) suppression of stimulus-evoked fMRI activation in tinnitus subjects when there is on-going background sound from the scanner coolant pump. (A) Neural activity (left) and fMRI activation (right) for a non-tinnitus subject and pump off. At left, the bars indicate the levels of baseline (diagonal shading) and stimulus-evoked neural activity (solid black), while the horizontal lines indicate a theoretical maximum amount of neural activity. At right, fMRI activation is depicted as the difference in neural activity between conditions. It is actually the difference in hemodynamic response to the neural activity of the two conditions, but hemodynamic response and neural activity are assumed to be directly proportional to one another in this panel and so are interchangeable. Thus, hemodynamic response is not shown. The dashed, horizontal lines on the axes for fMRI activation are provided to facilitate comparison of fMRI activation levels across panels (A – D). (B) Neural activity (left) and fMRI activation (right) for a non-tinnitus subject and pump on. Gray shading indicates neural activity evoked by the pump sounds. (C) Same as (A) but for a tinnitus subject. The neural activity evoked by sound is elevated compared to the non-tinnitus subject in (A), so fMRI activation is elevated also. (D) fMRI activation in the tinnitus subject is reduced by the pump (reduced compared to (C)) because either neural activity (left) or hemodynamic response (right) saturates at a maximum level. Note that the activity evoked by the pump sound (gray shading) in (D) is assumed to be the same as for the non-tinnitus subject in (B). If one were to instead make the equally reasonable assumption that neural activity evoked by the pump sound is elevated in the tinnitus subject by the same mechanisms that elevate the response to the sound stimulus, the suppression of fMRI activation in (D) (compared to (C)) would be greater than that shown.

Similar articles

Cited by

References

    1. Adjamian P, Sereda M, Hall DA. The mechanisms of tinnitus: perspectives from human functional neuroimaging. Hearing Res. Epub. 2009 - PubMed
    1. Arnold W, Barenstein P, Oestreicher E, Romer W, Schwaiger M. Focal metabolic activation in the predominant left auditory cortex in patients suffering from tinnitus: a PET study with [18F]deoxyglucose. ORL. 1996;58:195–199. - PubMed
    1. Beck AT, Epstein N, Brown G, Steer RA. An inventory for measuring clinical anxiety: Psychometric properties. J. Consult. Clin. Psychol. 1988;56:893–897. - PubMed
    1. Beck AT, Ward CH, Mendelson M, Mock J, Erbaugh An inventory for measuring depression. J. Arch. Gen. Psychiatry. 1961;4:561–571. - PubMed
    1. Brittain FH. The loudness of continuous spectrum noise and its application to loudness measurements. J Acoust Soc Am. 1939;11:113–117.

Publication types

MeSH terms