. 2009 Nov;1792(11):1062-72.
doi: 10.1016/j.bbadis.2009.08.007. Epub 2009 Aug 20.

Loss of Kupffer cells in diet-induced obesity is associated with increased hepatic steatosis, STAT3 signaling, and further decreases in insulin signaling

Affiliations

Loss of Kupffer cells in diet-induced obesity is associated with increased hepatic steatosis, STAT3 signaling, and further decreases in insulin signaling

Alicia H Clementi et al. Biochim Biophys Acta. 2009 Nov.

Abstract

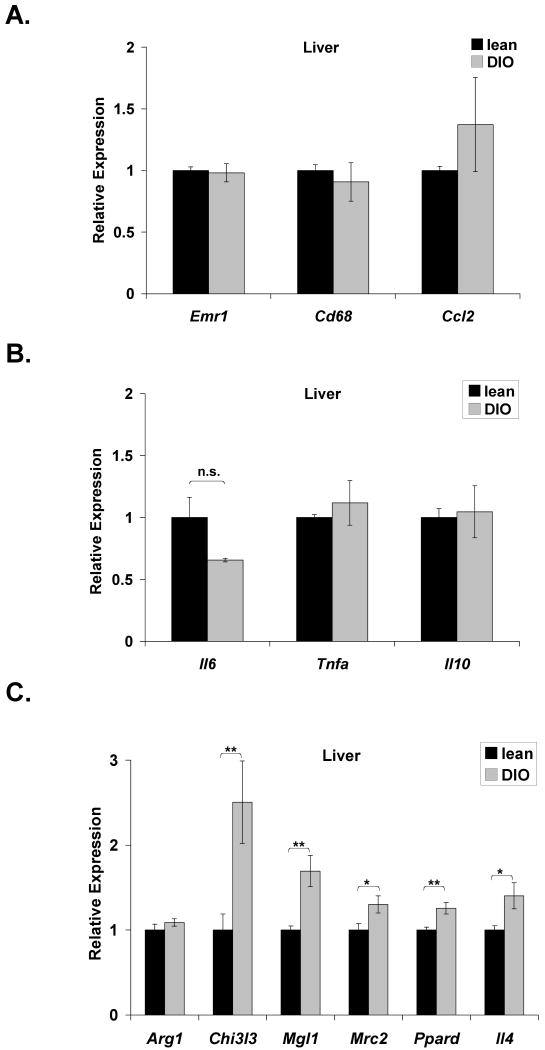
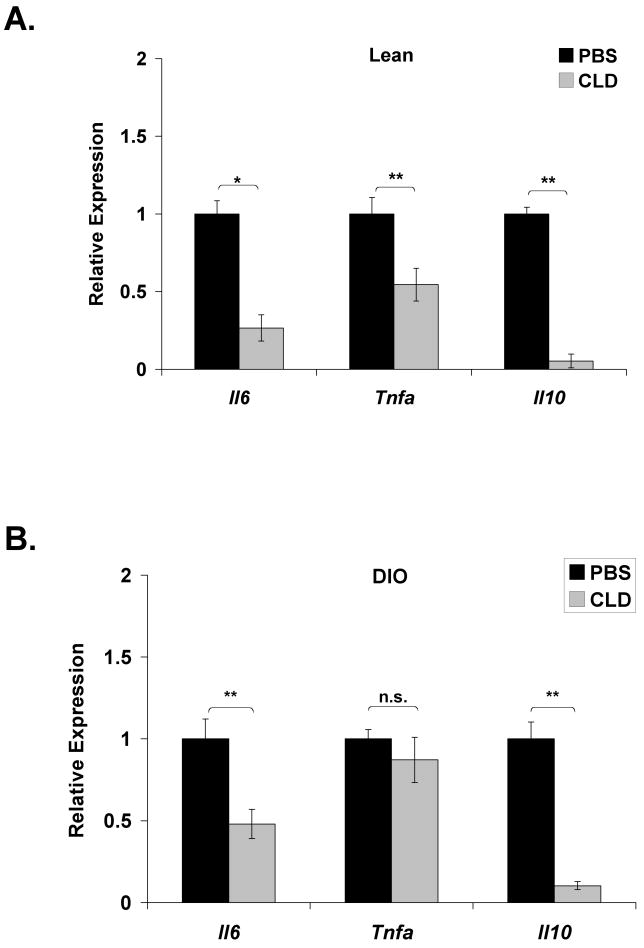
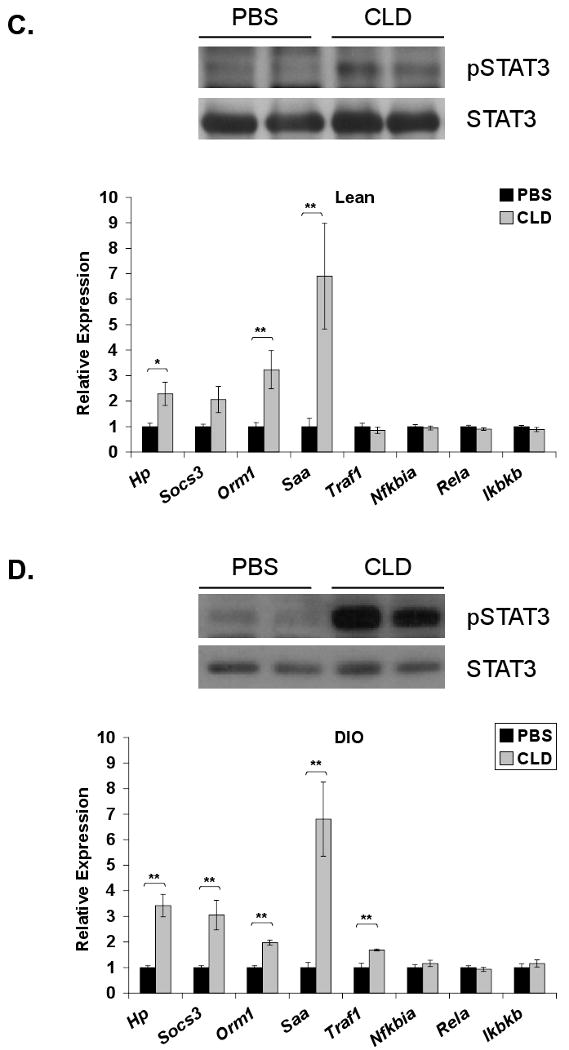
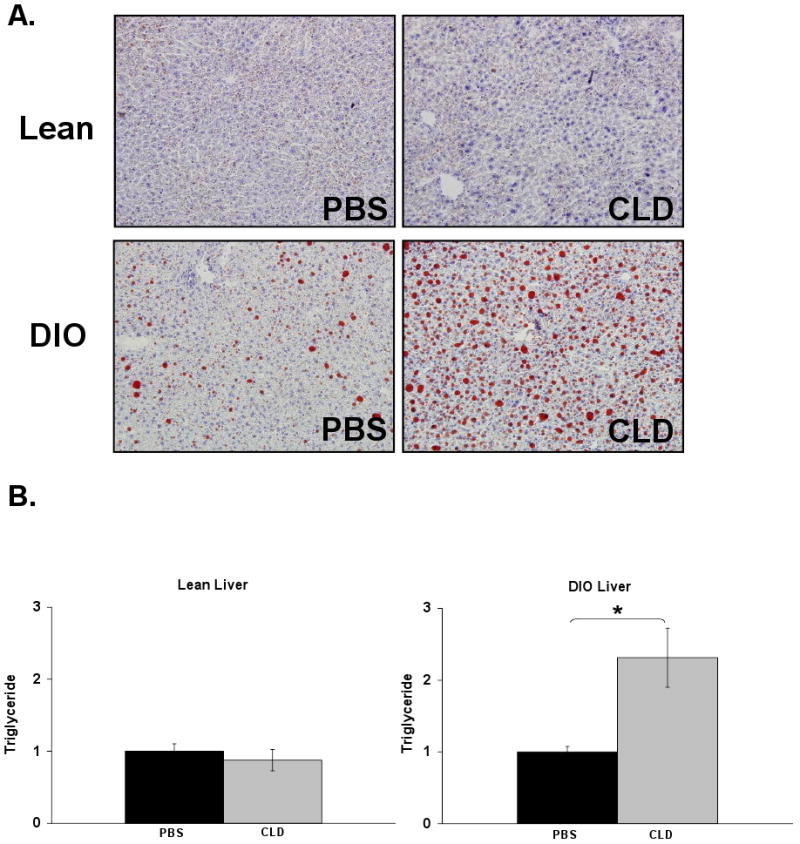
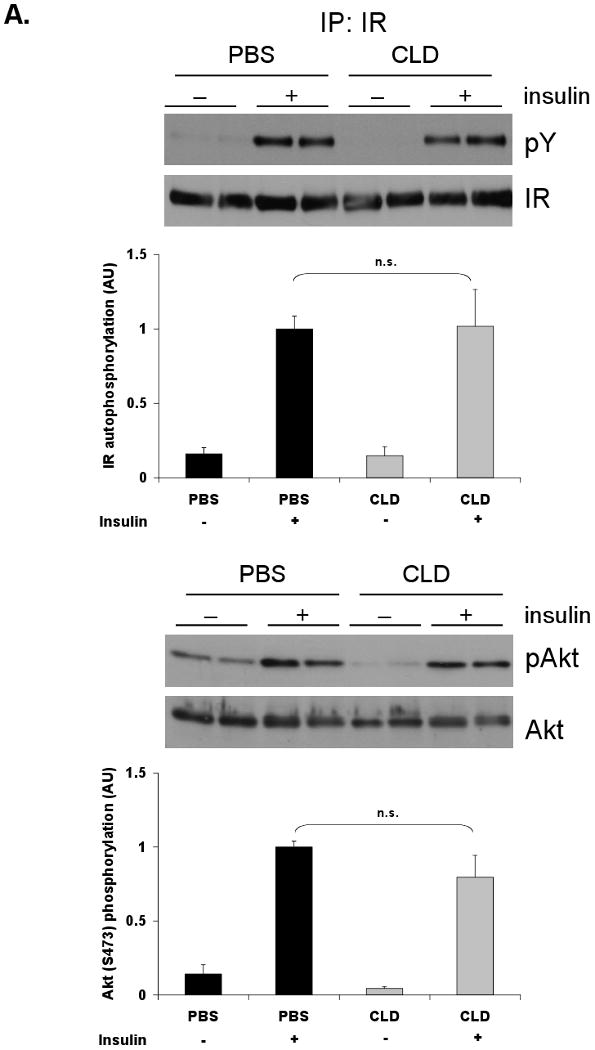
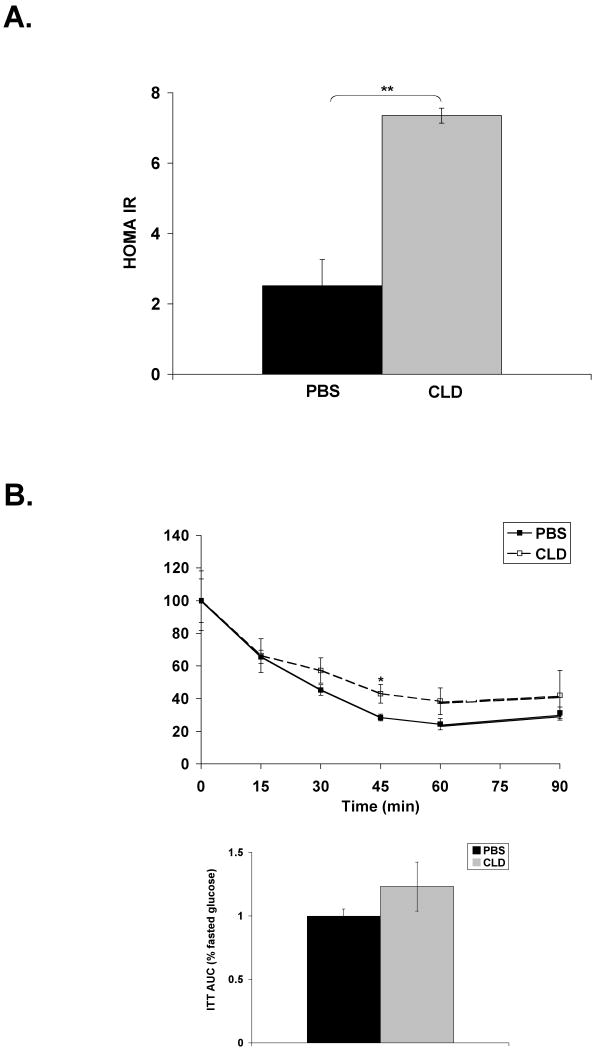
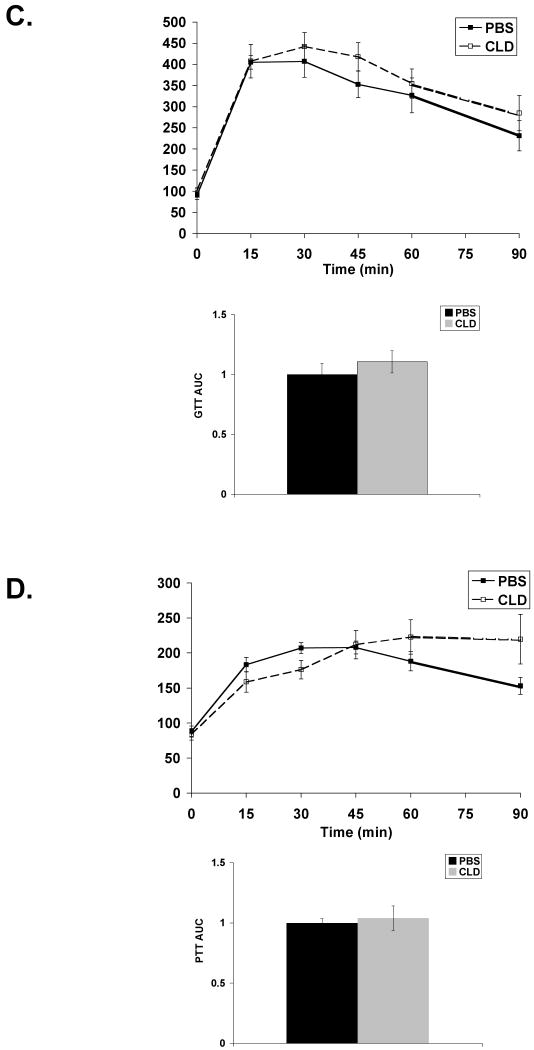
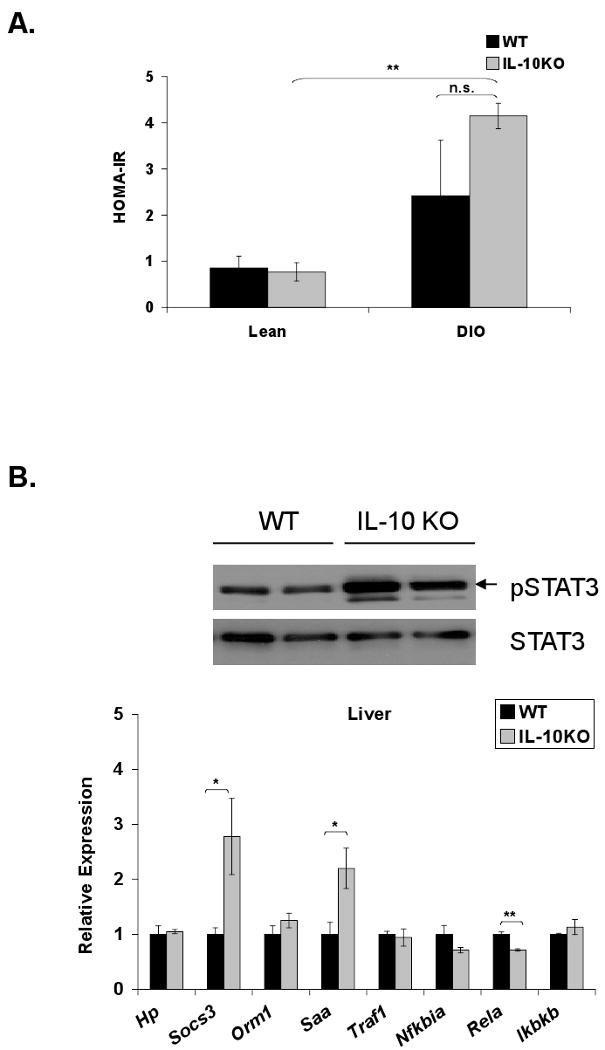
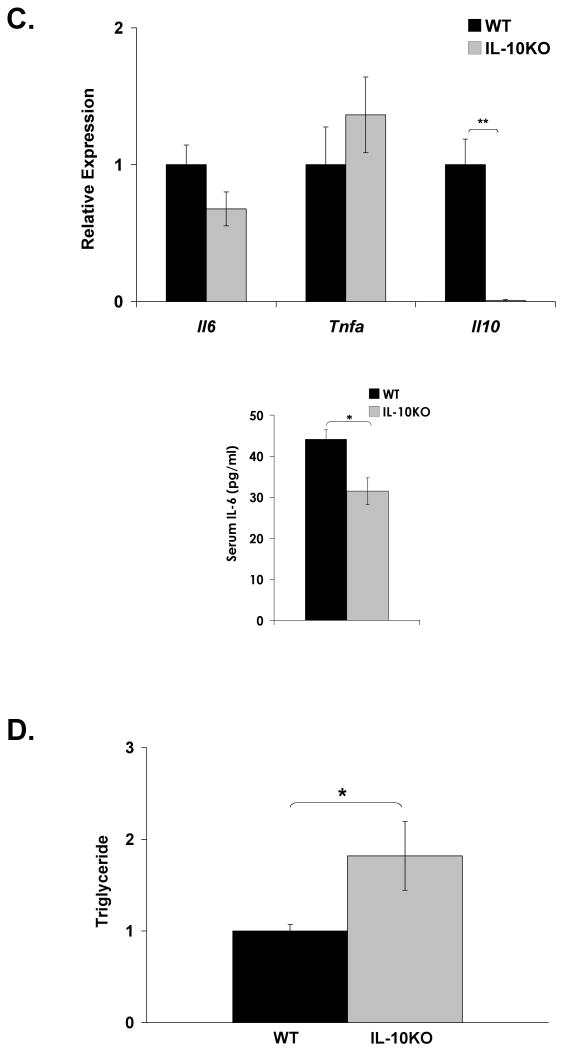
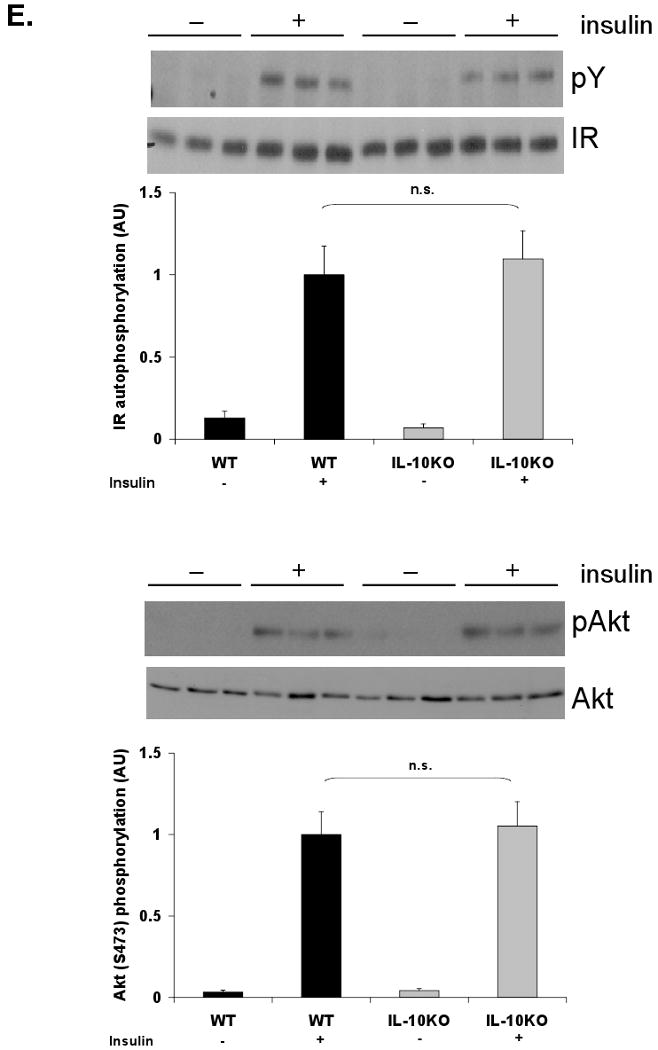
While adipose tissue-associated macrophages contribute to development of chronic inflammation and insulin resistance of obesity, little is known about the role of hepatic Kupffer cells in this environment. Here we address the impact of Kupffer cell ablation using clodronate-encapsulated liposome depletion in a diet-induced obese (DIO) and insulin resistant mouse model. Hepatic expression of macrophage markers measured by realtime RT-PCR remained unaltered in DIO mice despite characteristic expansion of adipose tissue-associated macrophages. DIO mouse livers displayed increased expression of alternative activation markers but unaltered proinflammatory cytokine expression when compared to lean mice. Kupffer cell ablation reduced hepatic anti-inflammatory cytokine IL-10 mRNA expression in lean and DIO mice by 95% and 84%, respectively. Despite decreased hepatic IL-6 gene expression after ablation in lean and DIO mice, hepatic STAT3 phosphorylation, Socs3 and acute phase protein mRNA expression increased. Kupffer cell ablation in DIO mice resulted in additional hepatic triglyceride accumulation and a 30-40% reduction in hepatic insulin receptor autophosphorylation and Akt activation. Implicating systemic loss of IL-10, high-fat-fed IL-10 knockout mice also displayed increased hepatic STAT3 signaling and hepatic triglyceride accumulation. Insulin signaling was not altered, however. In conclusion, Kupffer cells are a major source of hepatic IL-10 expression, the loss of which is associated with increased STAT3-dependent signaling and steatosis. One or more additional factors appear to be required, however, for the Kupffer cell-dependent protective effect on insulin receptor signaling in DIO mice.


Figures

Figure 1
Figure 1. Diet-induced obesity does not induce Kupffer cell expansion or activation
C57BL/6J mice were fed a normal chow (lean) or high-fat diet (DIO) ad libitum for 15 weeks. Realtime RT-PCR was performed on RNA extracted from liver tissue. Markers of macrophage presence (Emr1, Cd68) and recruitment (Ccl2) (A), inflammatory cytokines (B), and alternative activation (C) were measured in the liver of lean and DIO mice. Arg1 (arginase 1); Chi3l3 (chitinase 3-like 3); Mgl1 (macrophage galactose N-acetyl-galactosamine specific lectin 1); Mrc2 (mannose receptor, C type 2); Ppard (PPARδ), Il4 (interleukin-4). All markers were normalized to expression of 36B4. Lean mice: mean ±S.E. n=10. DIO mice: mean ±S.E. n=9. *p≤0.05; **p≤0.01
Figure 2
Figure 2. Loss of Kupffer cells results in increased STAT3-dependent signaling in lean and DIO mice
Lean and DIO mice were sacrificed 36 h following an intraperitoneal injection of PBS-containing or clodronate (CLD)-containing liposomes. RNA was extracted from the liver and realtime RT-PCR was performed for expression of inflammatory cytokines in (A) lean (mean ±S.E. n≥6) and (B) DIO (mean ±S.E. n≥16) mice. Hepatic IL-6-responsive genes (Hp, Socs3, Orm1, Saa) and TNF-α responsive genes (Traf1, Nfkbia, Rela, Ikbkb) were also assessed in lean (C) (mean ±S.E. n≥9) and DIO (D) (mean ±S.E. n≥4) mice and normalized to 36B4 expression. Western blot analysis for phosphorylation of STAT3 (Y705) was performed on liver extracts from lean (C) (mean ±S.E. n≥4) and DIO (D) (mean ±S.E. n=12) mice and compared to total STAT3 protein. Representative Western blots are presented. *p≤0.05; **p≤0.01
Figure 3
Figure 3. Kupffer cell ablation in DIO mice is associated with altered hepatic lipid content
Hepatic lipid content in normal chow-fed (lean) and diet-induced obese (DIO) mice was assessed 36 h following Kupffer cell ablation. A) Representative Oil Red O stained liver sections (20×) are displayed from mice treated with PBS- or CLD-containing liposomes. B) Lipids were extracted from frozen livers of lean (mean ±S.E. n=8) and DIO (mean ±S.E. n=6) mice. Triglyceride content (mg/wet weight) was normalized to protein content (mg/wet weight).
Figure 4
Figure 4. Kupffer cell ablation in DIO mice is associated with impaired hepatic insulin signaling
Following Kupffer cell ablation and an overnight fast, lean and DIO mice were given an i.p. insulin bolus (1.5 Units/kg). Tissues were harvested after 10 min. Tyrosine phosphorylation of the insulin receptor (IR) and Akt Ser473 phosphorylation were assessed by Western blot analysis in livers of lean (A) and DIO (B) mice. IR was immunoprecipitated prior to blotting. Each bar represents the mean ± S.E. of n≥7 (lean) and n≥9 (DIO). Mass blots are used to confirm comparable loading. Representative blots are shown. PBS = PBS-containing liposomes. CLD = clodronate-containing liposomes. *p≤0.05; **p≤0.01
Figure 5
Figure 5. Kupffer cell ablation in DIO mice has minor impact on systemic insulin response
DIO mice were Kupffer cell ablated and fasted overnight prior to i.p. injection of glucose, insulin, or pyruvate. Blood glucose was measured from tail vein at 15 min intervals. A) HOMA-IR determined from fasted serum insulin and glucose measurements. PBS n=10; CLD n=7. B) Insulin tolerance test (ITT) in response to 1.5U/kg insulin. C) Glucose tolerance test (GTT) in response to 1.5g/kg glucose. D) Pyruvate tolerance test (PTT) in response to 1.0g/kg sodium pyruvate. Results for ITT are normalized to percent starting (fasted) glucose. AUC is plotted for each challenge test. For tolerance tests, PBS n=5; CLD n>5. PBS = PBS-containing liposomes. CLD = clodronate-containing liposomes. *p≤0.05
Figure 6
Figure 6. DIO IL-10 knockout mice do not display altered hepatic insulin responsiveness
IL-10 knockout (IL-10KO) and wild-type (WT) mice were fed a high-fat diet for 8 weeks. A) HOMA-IR was calculated from glucose and insulin concentrations of 16-h fasted WT and IL-10KO mice (mean ± S.E. of n≥4). B) Western blot analysis for phosphorylation of STAT3 (Y705) was performed on whole cell extracts from WT and IL-10KO mouse liver. Hepatic expression of IL-6-responsive genes and TNF-α responsive genes was assessed by realtime RT-PCR (mean ± S.E. of n=6). C) Hepatic cytokine expression was assessed by realtime RT-PCR (mean ± S.E. of n=6). Circulating IL-6 levels were measured by a Luminex® Beadlyte® assay (mean ± S.E. of n=6). D) Hepatic triglyceride content (mg/wet weight) was quantified in WT and IL-10KO mice and normalized to protein (mg/wet weight) (mean ± S.E. of n=11). High-fat-fed WT and IL-10KO mice were fasted overnight prior to an i.p. injection of insulin (1.5 Units/kg). Tissues were harvested after 10 min. E) Tyrosine phosphorylation of the insulin receptor (IR) and Akt Ser473 phosphorylation in livers of WT and KO mice were assessed by Western blot analysis (mean ± S.E. of n=6). IR was immunoprecipitated prior to blotting. IR and Akt mass blots are included for comparison. *p≤0.05; **p≤0.01

Similar articles

Cited by

References

    1. Trayhurn P, Wood IS. Adipokines: inflammation and the pleiotropic role of white adipose tissue. Br J Nutr. 2004;92:347–355. - PubMed
    1. Kern PA, Ranganathan S, Li C, Wood L, Ranganathan G. Adipose tissue tumor necrosis factor and interleukin-6 expression in human obesity and insulin resistance. Am J Physiol Endocrinol Metab. 2001;280:E745–751. - PubMed
    1. Kern PA, Saghizadeh M, Ong JM, Bosch RJ, Deem R, Simsolo RB. The expression of tumor necrosis factor in human adipose tissue. Regulation by obesity, weight loss, and relationship to lipoprotein lipase. J Clin Invest. 1995;95:2111–2119. - PMC - PubMed
    1. Bastard JP, Maachi M, Van Nhieu JT, Jardel C, Bruckert E, Grimaldi A, Robert JJ, Capeau J, Hainque B. Adipose tissue IL-6 content correlates with resistance to insulin activation of glucose uptake both in vivo and in vitro. J Clin Endocrinol Metab. 2002;87:2084–2089. - PubMed
    1. Senn JJ, Klover PJ, Nowak IA, Zimmers TA, Koniaris LG, Furlanetto RW, Mooney RA. Suppressor of cytokine signaling-3 (SOCS-3), a potential mediator of interleukin-6-dependent insulin resistance in hepatocytes. J Biol Chem. 2003;278:13740–13746. - PubMed

Publication types

MeSH terms