Comparative Study
. 2009 Nov 17:1298:57-69.
doi: 10.1016/j.brainres.2009.08.038. Epub 2009 Aug 21.

Comparison of somatostatin and corticotrophin-releasing hormone immunoreactivity in forebrain neurons projecting to taste-responsive and non-responsive regions of the parabrachial nucleus in rat

Affiliations
Comparative Study

Comparison of somatostatin and corticotrophin-releasing hormone immunoreactivity in forebrain neurons projecting to taste-responsive and non-responsive regions of the parabrachial nucleus in rat

Siva Panguluri et al. Brain Res. .

Abstract

Several forebrain areas have been shown to project to the parabrachial nucleus (PBN) and exert inhibitory and excitatory influences on taste processing. The neurochemicals by which descending forebrain inputs modulate neural taste-evoked responses remain to be established. This study investigated the existence of somatostatin (SS) and corticotrophin-releasing factor (CRF) in forebrain neurons that project to caudal regions of the PBN responsive to chemical stimulation of the anterior tongue as well as more rostral unresponsive regions. Retrograde tracer was iontophoretically or pressure ejected from glass micropipettes, and 7 days later the animals were euthanized for subsequent immunohistochemical processing for co-localization of tracer with SS and CRF in tissue sections containing the lateral hypothalamus (LH), central nucleus of the amygdala (CeA), bed nucleus of the stria terminalis (BNST), and insular cortex (IC). In each forebrain site, robust labeling of cells with distinguishable nuclei and short processes was observed for SS and CRF. The results indicate that CRF neurons in each forebrain site send projections throughout the rostral caudal extent of the PBN with a greater percentage terminating in regions rostral to the anterior tongue-responsive area. For SS, the percentage of double-labeled neurons was more forebrain site specific in that only BNST and CeA exhibited significant numbers of double-labeled neurons. Few retrogradely labeled cells in LH co-expressed SS, while no double-labeled cells were observed in IC. Again, tracer injections into rostral PBN resulted in a greater percentage of double-labeled neurons in BNST and CeA compared to caudal injections. The present results suggest that some sources of descending forebrain input might utilize somatostatin and/or CRF to exert a broad influence on sensory information processing in the PBN.


Figures

Figure 1
Figure 1
Montage photomicrograph images of tracer injections into the caudal region of the PBN responsive to NaCl stimulation of the anterior tongue (panels A & B) and the rostral unresponsive region of PBN (panels C & D). The dark areas outlined by closely spaced white bars in panels A, B and C represent the core of fluorogold injection, while the bright area in panel D represents that of green fluorescent microbead injection. The approximate boundary of the superior cerebellar peduncle (scp) is outlined by longer more widely spaced bars (white, panels A, B and D; black, panel C). The scale bar in each panel equals approximately 100 µm.
Figure 2
Figure 2
The different fill patterns represent the extent of individual tracer injections concentrated in the caudal and rostral regions of PBN. Sections are arranged from rostral (top) to caudal (bottom) and lateral is to the right. The approximate levels relative to bregma are indicated at the top left of each figure (Paxinos and Watson, 1998). For each level, a separate diagram immediately to the right is labeled with PBN subnuclei as defined in Paxinos and Watson (1998). The circumference of all injections at each PBN level is outlined by large black dots and superimposed over PBN subnuclei. The scale bar equals approximately 1 mm.
Figure 3
Figure 3
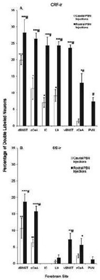
The mean percentage of retrogradely labeled neurons in the dBNST, cCeA, IC, LH, vBNST, rCeA and PVN co-expressing CRF-ir (A) or SS-ir (B) following injections into the caudal (open bars) or rostral (solid bars) PBN. For caudal PBN injections, only dBNST, cCeA, IC, LH and rCeA were not included in analyses of significance because no retrograde labeled cells were observed in vBNST and PVN. Caudal PBN Injections: **, significantly different from all other groups; *, significantly different from rCeA. Rostral PBN Injections: ****, dBNST and cCeA significantly different from all other groups; ***, significantly different from rCeA and PVN; **, significantly different from IC, LH and PVN; *, significantly different from PVN. #, rostral PBN injections significantly different from caudal PBN injections.
Figure 4
Figure 4
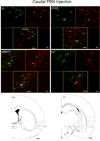
Representative photomicrographs of neurons projecting to caudal PBN and immunoreactive for CRF in the IC, cCeA, dBNST and LH. In each panel, the image at top left (green dotted box) shows fluorogold (FG) retrogradely labeled neurons only (green), top right (red dotted box) CRF-ir cells (red) only and bottom middle (yellow dotted box) the merged confocal images. Yellow indicates double labeled neurons. Double headed arrows point to examples of green FG labeled cells that were not CRF-ir, while single headed arrows point to neurons immunoreactive for FG and CRF. In each panel, a scale bar is shown in the merged image (white, 50 µm) and the magnification is given in the lower right corner. Below the photomicrographs are two schematic representations showing the general location of retrogradely labeled neurons in each forebrain area. The approximate levels relative to bregma are indicated at the top left corner in each drawing (Paxinos and Watson, 1998).
Figure 5
Figure 5
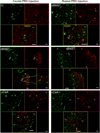
Representative photomicrographs of neurons projecting to rostral PBN and immunoreactive for CRF in the IC, dBNST, vBNST, cCeA, LH and PVN. In each panel, the image at top left (green dotted box) shows fluorogold (FG) retrogradely labeled neurons only (green), top right (red dotted box) CRF-ir cells only (red) and bottom middle (yellow dotted box) the merged confocal images. Yellow indicates double labeled neurons. Double headed arrows point to examples of green FG labeled cells that were not CRF-ir, while single headed arrows point to neurons immunoreactive for FG and CRF. In each panel, a scale bar is shown in the merged image (white, 50 µm) and the magnification is given in the lower right corner. The inset from the merged images in LH and PVN shows the area between the ends of the dotted white lines re sampled at 300% the original size. Below the photomicrographs are two schematic representations showing the general location of retrogradely labeled neurons in each forebrain area except PVN. The approximate levels relative to bregma are indicated at the top left corner in each drawing (Paxinos and Watson, 1998).
Figure 6
Figure 6
Representative photomicrographs of neurons projecting to caudal or rostral PBN and immunoreactive for SS in the IC, dBNST, vBNST, cCeA, LH and PVN. In each panel, the image at top left (green dotted box) shows fluorogold (FG) retrogradely labeled neurons only (green), top right (red dotted box) SS-ir cells only (red) and bottom middle (yellow dotted box) the merged confocal images. Yellow indicates double labeled neurons. Double headed arrows point to examples of green FG labeled cells that were not SS-ir, while single headed arrows point to neurons immunoreactive for FG and SS. In each panel, a scale bar is shown in the merged image (white, 50 µm) and the magnification is given in the lower right corner. The inset from the merged images in dBNST shows the area between the ends of the dotted white lines re sampled at 300% the original size.

Similar articles

Cited by

References

    1. az-Casares A, Lopez-Gonzalez MV, Peinado-Aragones CA, Lara JP, Gonzalez-Baron S, wid-Milner MS. Role of the parabrachial complex in the cardiorespiratory response evoked from hypothalamic defense area stimulation in the anesthetized rat. Brain Res. 2009 Jul 7;1279:58–70. - PubMed
    1. Baird JP, Travers JB, Travers SP. Parametric analysis of gastric distension responses in the parabrachial nucleus. Am.J.Physiol Regul.Integr.Comp Physiol. 2001a;281(5):R1568–R1580. - PubMed
    1. Baird JP, Travers SP, Travers JB. Integration of gastric distension and gustatory responses in the parabrachial nucleus. Am.J.Physiol Regul.Integr.Comp Physiol. 2001b;281(5):R1581–R1593. - PubMed
    1. Bester H, Chapman V, Besson JM, Bernard JF. Physiological properties of the lamina I spinoparabrachial neurons in the rat. J.Neurophysiol. 2000;83(4):2239–2259. - PubMed
    1. Bester H, Menendez L, Besson JM, Bernard JF. Spino (trigemino) parabrachiohypothalamic pathway: electrophysiological evidence for an involvement in pain processes. J.Neurophysiol. 1995;73(2):568–585. - PubMed

Publication types

LinkOut - more resources