. 2009 Oct 22;114(17):3588-600.
doi: 10.1182/blood-2009-02-206342. Epub 2009 Aug 21.

HIV-1 gp120-induced migration of dendritic cells is regulated by a novel kinase cascade involving Pyk2, p38 MAP kinase, and LSP1

Affiliations

HIV-1 gp120-induced migration of dendritic cells is regulated by a novel kinase cascade involving Pyk2, p38 MAP kinase, and LSP1

Appakkudal R Anand et al. Blood. .

Abstract

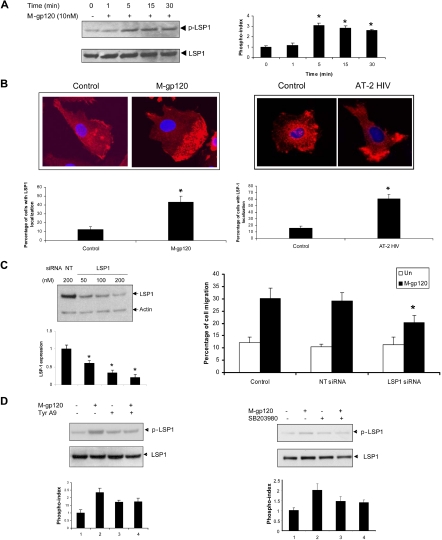
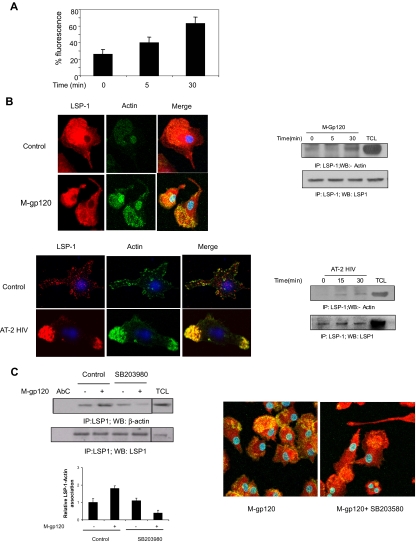
Targeting dendritic cell (DC) functions such as migration is a pivotal mechanism used by HIV-1 to disseminate within the host. The HIV-1 envelope protein is the most important of the virally encoded proteins that exploits the migratory capacity of DCs. In the present study, we elucidated the signaling machinery involved in migration of immature DCs (iDCs) in response to HIV-1 envelope protein. We observed that M-tropic HIV-1 glycoprotein 120 (gp120) induces phosphorylation of the nonreceptor tyrosine kinase, Pyk2. Inhibition of Pyk2 activity using a pharmacologic inhibitor, kinase-inactive Pyk2 mutant, and Pyk2-specific small interfering RNA blocked gp120-induced chemotaxis, confirming the role of Pyk2 in iDC migration. In addition, we also illustrated the importance of Pyk2 in iDC migration induced by virion-associated envelope protein, using aldithriol-2-inactivated M-tropic HIV-1 virus. Further analysis of the downstream signaling mechanisms involved in gp120-induced migration revealed that Pyk2 activates p38 mitogen-activated protein kinase, which in turn activates the F-actin-binding protein, leukocyte-specific protein 1, and enhances its association with actin. Taken together, our studies provide an insight into a novel gp120-mediated pathway that regulates DC chemotaxis and contributes to the dissemination of HIV-1 within an infected person.


Figures

Figure 1
Figure 1
M-tropic HIV-1 envelope causes activation of Pyk2 in iDCs. (A) The surface expression of DC-SIGN, CD14, HLA-DR, CD1a, CD4, CCR5, and CXCR4 on immature dendritic cells was analyzed by flow cytometry. Monocyte-derived immature dendritic cells harvested on the sixth day of differentiation were stained with FITC-conjugated antibodies for CD14, CD1a, and CCR5; PE-conjugated antibodies for DC-SIGN and CXCR4; and APC-conjugated antibodies for HLA-DR and CD4. Cells were also stained with FITC-, PE-, or APC-conjugated isotype antibody controls. Filled peaks indicate antibody control and open peaks indicate receptor expression. (B) iDCs were stimulated with M-tropic gp120 (10 nM) for the indicated periods of time at 37°C. The lysates were analyzed by Western blot analysis using antibodies to phospho-Pyk2 (Tyr 402; first panel), phospho-Pyk2 (Tyr 580; second panel), and phospho-Pyk2 (Tyr 881; third panel). The same blot was then probed with total Pyk2 antibody. iDCs were also stimulated with various concentrations of M-tropic gp120 (0-100 nM) for 15 minutes at 37°C. The lysates were analyzed by Western blot analysis using antibodies specific to phospho-Pyk2 (Tyr 402; fourth panel). iDCs were stimulated with T-tropic gp120 (10 nM) for the indicated periods of time at 37°C and lysates analyzed by Western blot analysis using antibodies specific to phospho-Pyk2 (Tyr 402; fifth panel). The phosphorylation indices of the respective blots are shown at the right of the panels. For quantitative analysis of protein phosphorylation, the ratio of phosphorylation versus total protein in each lane was obtained by densitometry. The phosphorylation index was determined by calculating the value of this ratio in each lane and presenting the ratio as the fold increase over the control value (unstimulated sample; 0), which was designated as 1. *P < .05 versus the unstimulated control. Values on the right panel are mean ± SD of 3 independent experiments. Data on the left panel show one representative experiment of 3 independent experiments. (C) iDCs were stimulated with AT-2–inactivated HIV-1 (YU2; 3 μg/mL p24) for the indicated periods of time at 37°C. The lysates were analyzed by Western blot analysis using antibodies to phospho-Pyk2 (Tyr 402; left panel). The same blot was then probed with total Pyk2 antibody. The phosphorylation index of the blot is shown in the right panel. *P < .05 versus the unstimulated control. Values on the right panel are mean ± SD of 3 independent experiments. Data on left panel show 1 representative experiment of 3 independent experiments.
Figure 2
Figure 2
M-tropic HIV envelope induces migration of iDCs via CCR5. (A) The ability of monocyte-derived iDCs to migrate in response to various concentrations of HIV-1 M-tropic gp120 (0-50 nM) and the heat-inactivated (HI) control was analyzed using transwell migration assays. *P < .05 versus the heat-inactivated control. (B) Migration of iDCs in response to various clones of M-tropic gp120, YU2, ADA, and BaL (10 nM) was determined using transwell assays. *P < .05 versus the untreated control. (C) iDCs were pretreated with anti-CCR5 neutralizing antibodies (10 μg/mL) or RANTES (100 nM) for 1 hour at 37°C. The cells were then used in transwell migration assays in response to M-tropic gp120 (10 nM) and AT-2 HIV-1 (used at a final concentration of 3 μg p24/mL). *P < .05 versus the gp120-treated control. **P < .05 versus the AT-2 HIV-treated control. Data represent mean ± SD of 3 independent experiments. (D) iDCs were treated with tyrphostin (5 μM) or vehicle alone at 37°C for 1 hour and subsequently incubated with medium alone or M-gp120 (100 nM) at 37°C for different periods of time. After washing, cells were stained with control mouse IgG or monoclonal CCR5-FITC antibody. The percentage of cells positively stained with anti-CCR5 Ab was determined by flow cytometry. The graph shows a comparison of the percentage of internalization between the tyrphostin A9–treated and vehicle-treated iDCs stimulated with M-gp120. Results are representative of 3 separate experiments.
Figure 3
Figure 3
Inhibition of Pyk2 activation attenuates M-tropic gp120–induced iDC migration. (A) iDCs were pretreated with vehicle (dimethyl sulfoxide) or tyrphostin A9 (5 μM) for 1 hour at 37°C. The migration of these cells in response to M-tropic gp120 (10 nM) (left panel) or AT-2–inactivated virions (3 μg/mL p24) was determined after 3 hours of incubation. *P < .05 versus the vehicle control. (B) iDCs infected with rAAV5-expressing GFP protein were analyzed for GFP expression 48 hours after infection (top left panel) using a Zeiss Axiovert 40 CFL microscope (40×/0.50 NA). The fluorescence micrographs are shown on the right, whereas the corresponding phase-contrast image is shown on the left of the panel. iDCs were then transduced with recombinant AAV5-expressing Pyk2 mutant (Pyk2MT) or Pyk2 wild-type (Pyk2WT). Overexpression of the mutant and wild-type Pyk2 was demonstrated by Western blot analysis with anti-Pyk2 antibodies 48 hours after transduction. (Top and bottom right panels) Anti–glyceraldehyde phosphate dehydrogenase antibody was used as an internal control. The bar graph at the bottom of the panels shows the quantitative analysis of Pyk2 expression obtained by densitometry. *P < .05 versus the vector control. Data represent mean ± SD of 3 independent experiments. The transduced cells were tested for their ability to migrate in response to M-tropic gp120 (10 nM) using the chemotaxis assay (bottom left panel). *P < .05 versus the M-tropic gp120–treated vector control. Data represent mean ± SD of 3 independent experiments. (C) iDCs were transfected with Pyk2-specific siRNA and nontargeting siRNA (NT siRNA) using nucleofection (Amaxa Biosystems). The knockdown of Pyk2 expression was analyzed by Western blot analysis with anti-Pyk2 antibodies (left panel). Antiactin antibody served as a control. The bar graph at the bottom of the panel shows the quantitative analysis of Pyk2 expression obtained by densitometry. *P < .05 versus the nontargeting vector control. Data represent mean ± SD of 3 independent experiments. The siRNA-transfected iDCs were used in the transwell migration assay in response to gp120 (10 nM; right panel). *P < .05 versus the M-tropic gp120–treated nontargeting siRNA control. Data represent mean ± SD of 3 independent experiments.
Figure 4
Figure 4
p38 MAP kinase mediates gp120-induced iDC chemotaxis downstream of Pyk2. (A) iDCs were pretreated with SB203589 (10 μM) for 1 hour at 37°C and stimulated with gp120 (10 nM) at 37°C for various periods of time. The cells were lysed and analyzed by Western blotting with anti–phospho-p38 antibodies (left panel). The same blots were reprobed with anti-p38 antibodies. iDCs were pretreated with vehicle or tyrphostin A9 (5 μM) for 1 hour at 37°C. The cells were then stimulated with HIV-1 gp120 for 15 minutes, lysed, and analyzed by Western blotting with anti–phospho-p38 antibody (right panel). The same blot was reprobed with anti-p38 antibody. The bar graph at the bottom of the panels represents the phosphorylation index as obtained by densitometry. *P < .05 versus the unstimulated control. Data represent mean ± SD of 3 independent experiments. (B) iDCs were pretreated with PD98059 (10 μM) for 1 hour at 37°C and stimulated with gp120 (10 nM) at 37°C for various periods of time. The cells were lysed and analyzed by Western blotting with anti–p-ERK1/2 antibodies. The same blots were reprobed with anti–ERK1/2 antibodies. Data show 1 representative experiment of 3 independent experiments. (C) iDCs were pretreated with vehicle or various concentrations of the p38 MAP kinase inhibitors, SB203580 (top left panel) and SB220025 (top right panel) as well as the ERK kinase inhibitor (PD98059; bottom panel) for 1 hour at 37°C. The migration of these cells in response to M-tropic gp120 (10 nM) was determined after 3 hours of incubation. *P < .05 versus the vehicle control.
Figure 5
Figure 5
Activation of the LSP1 downstream of Pyk2 and p38 MAP kinase mediates gp120-induced iDC chemotaxis. (A) iDCs were untreated (0) or stimulated with M-tropic gp120 (10 nM) for the indicated time points. The cells were lysed and analyzed by Western blotting with p-LSP1 (left panel) antibody. The blots were stripped and reprobed with anti-LSP1 antibody. The bar graph (right panel) represents the phosphorylation index as obtained by densitometry. *P < .05 versus the unstimulated control. Data represent mean ± SD of 3 independent experiments. (B) iDCs cultured in chambered slides were treated with M-tropic gp120 (10 nM; left panel) or AT-2 HIV-1 (right panel) for 30 minutes. The cells were then fixed, permeabilized, and treated with rabbit anti-LSP1antibody. After washing, cells were probed with Alexa 568–tagged anti–rabbit IgG antibody and the slides were mounted using Prolong Gold antifade with DAPI (Invitrogen), and then examined under a Zeiss confocal microscope (63×/1.4 oil). The pictures were acquired using LSM 510 software. (C) iDCs were transfected with LSP1-specific siRNA and nontargeting siRNA (NT siRNA) using nucleofection (Amaxa Biosystems). The knockdown of LSP1 expression was analyzed by Western blot analysis with anti-LSP1 antibodies (left panel). Antiactin antibody served as a control. The bar graph at the bottom of the panel shows the quantitative analysis of LSP1 expression obtained by densitometry. *P < .05 versus the nontargeting vector control. Data represent mean ± SD of 3 independent experiments. The siRNA-transfected iDCs were used in the transwell migration assay in response to gp120 (10 nM; right panel). *P < .05 versus the M-tropic gp120–treated nontargeting siRNA control. (D) iDCs were pretreated with vehicle or tyrphostin A9 (5 μM) (left panel) or p38 MAP kinase inhibitor, SB203580 (30 μM; right panel), for 1 hour at 37°C. The cells were then stimulated with gp120 (10 nM) for 30 minutes. The cells were lysed and analyzed by Western blotting with anti–phospho-LSP1 antibody. The same blots were probed with anti-LSP1 antibody. The bar graph at the bottom of the panels represents the phosphorylation index as obtained by densitometry. *P < .05 versus the unstimulated control. Data represent mean ± SD of 3 independent experiments. Data show one representative experiment of 3 independent experiments.
Figure 6
Figure 6
Gp120 induces LSP-1–actin association downstream of p38 MAP kinase. (A) iDCs were untreated (0) or treated with M-tropic gp120 and stained with Alexa Fluor 488–phalloidin (Invitrogen) and the cells were analyzed by flow cytometry. (B) iDCs were cultured in chambered slides, and either left untreated (C or 0) and were treated with M-tropic gp120 (top left panel) or AT-2–inactivated HIV-1 (bottom left panel) for 30 minutes. Then cells were fixed and treated with rabbit anti–LSP-1antibody. After washing, cells were probed with Alexa 568–tagged anti–rabbit IgG antibody and Alexa Fluor 488–phalloidin. The slides were mounted using Prolong Gold antifade with DAPI (Invitrogen), and then examined under a Zeiss confocal microscope (63×/1.4 oil). The pictures were acquired using LSM 510 software. iDCs were unstimulated or stimulated with M-tropic gp120 (10 nM; top right panel) or AT-2 HIV (3 μg/mL p24; bottom right panel) for various time periods. The cells were lysed, and the lysates were immunoprecipitated with anti–LSP-1 antibody and immunoblotted with anti–β-actin antibody (top panel). The blots were stripped and reprobed with anti–LSP 1 antibody (bottom panel) to check the protein concentration in each lane. (C) iDCs were unstimulated or stimulated with M-tropic gp120 (10 nM) for 30 minutes in presence or absence of p38 inhibitor, SB203580 (30μM). The cells were lysed, and the lysates were immunoprecipitated with anti–LSP-1 antibody and Western blotted with anti–β-actin antibody (left panel). The blots were stripped and reprobed with anti–LSP-1 antibody to check the protein concentration in each lane. A vertical line has been inserted to indicate a repositioned gel lane. The bar graph at the bottom of the panel shows the quantitative analysis of LSP-1–actin association of the blots as obtained by densitometry.*P < .05 versus the unstimulated control. Data represent mean ± SD of 3 independent experiments. iDCs were cultured in chambered slides, then treated with M-tropic gp120 for 30 minutes in presence or absence of p38 inhibitor, SB203580 (30 μM). The cells were fixed and treated with rabbit anti–LSP-1 antibody. After washing, cells were probed with Alexa 568–tagged anti–rabbit IgG antibody and Alexa Fluor 488–phalloidin (right panel). The slides were mounted using Prolong Gold antifade with DAPI (Invitrogen), and then examined under a Zeiss confocal microscope (63×/1.4 oil). The pictures were acquired using LSM 510 software.
Figure 7
Figure 7
Proposed scheme of the signaling pathway leading to immature dendritic cell chemotaxis upon exposure to M-tropic gp120.

Similar articles

Cited by

References

    1. Reece JC, Handley AJ, Anstee EJ, Morrison WA, Crowe SM, Cameron PU. HIV-1 selection by epidermal dendritic cells during transmission across human skin. J Exp Med. 1998;187(10):1623–1631. - PMC - PubMed
    1. Hussain LA, Lehner T. Comparative investigation of Langerhans' cells and potential receptors for HIV in oral, genitourinary and rectal epithelia. Immunology. 1995;85(3):475–484. - PMC - PubMed
    1. Hladik F, Sakchalathorn P, Ballweber L, et al. Initial events in establishing vaginal entry and infection by human immunodeficiency virus type-1. Immunity. 2007;26(2):257–270. - PMC - PubMed
    1. Wang JH, Janas AM, Olson WJ, Wu L. Functionally distinct transmission of human immunodeficiency virus type 1 mediated by immature and mature dendritic cells. J Virol. 2007;81(17):8933–8943. - PMC - PubMed
    1. Chougnet C, Gessani S. Role of gp120 in dendritic cell dysfunction in HIV infection. J Leukoc Biol. 2006;80(5):994–1000. - PubMed

Publication types

MeSH terms