. 2009 Oct 29;114(18):3841-53.
doi: 10.1182/blood-2009-02-202481. Epub 2009 Aug 21.

Potent HIV-specific responses are enriched in a unique subset of CD8+ T cells that coexpresses CD4 on its surface

Affiliations

Potent HIV-specific responses are enriched in a unique subset of CD8+ T cells that coexpresses CD4 on its surface

Andrew Zloza et al. Blood. .

Abstract

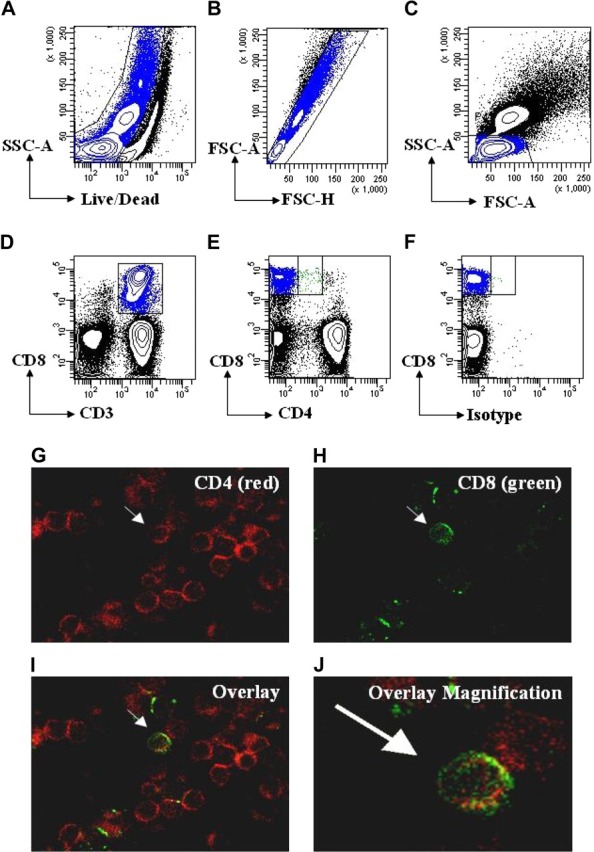
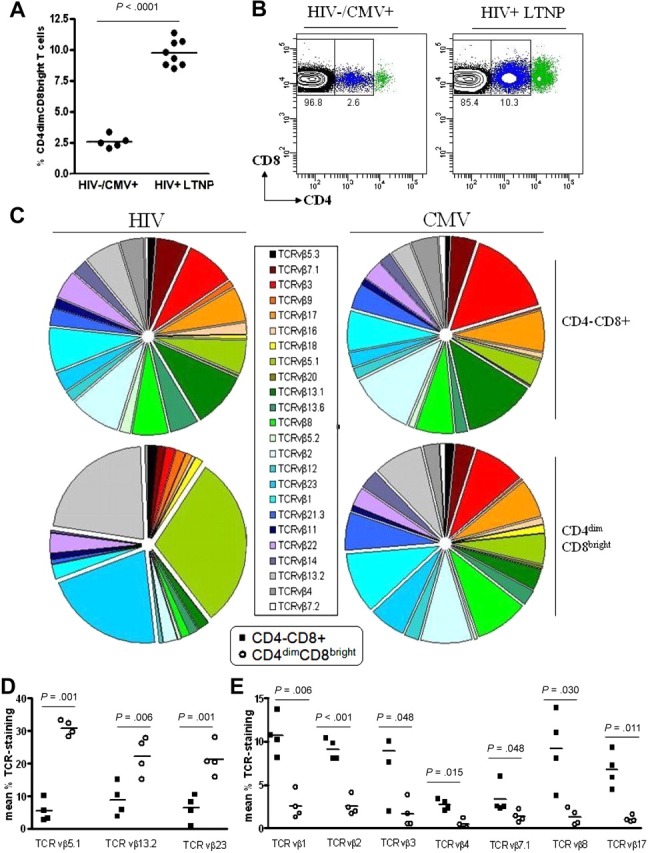
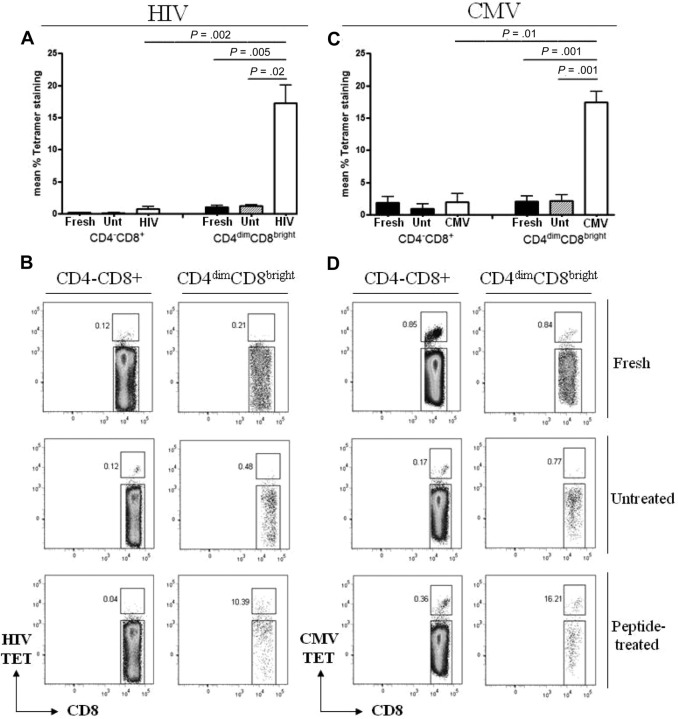
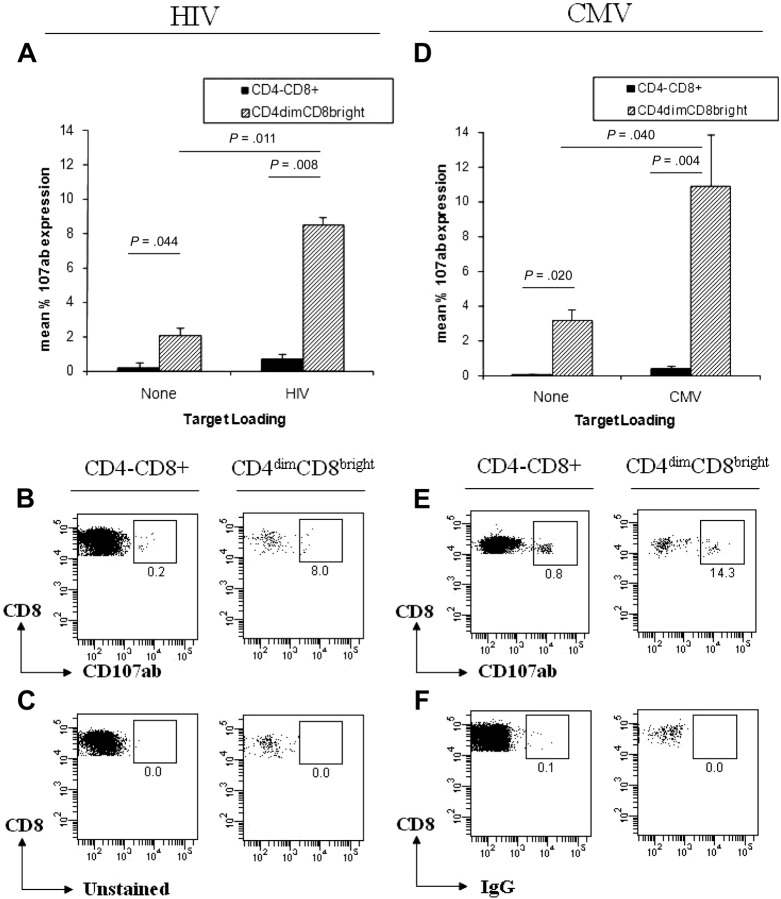
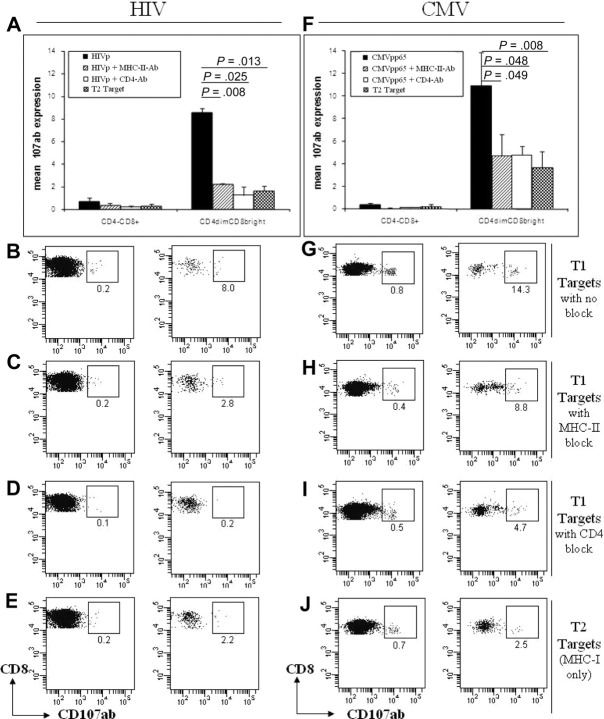
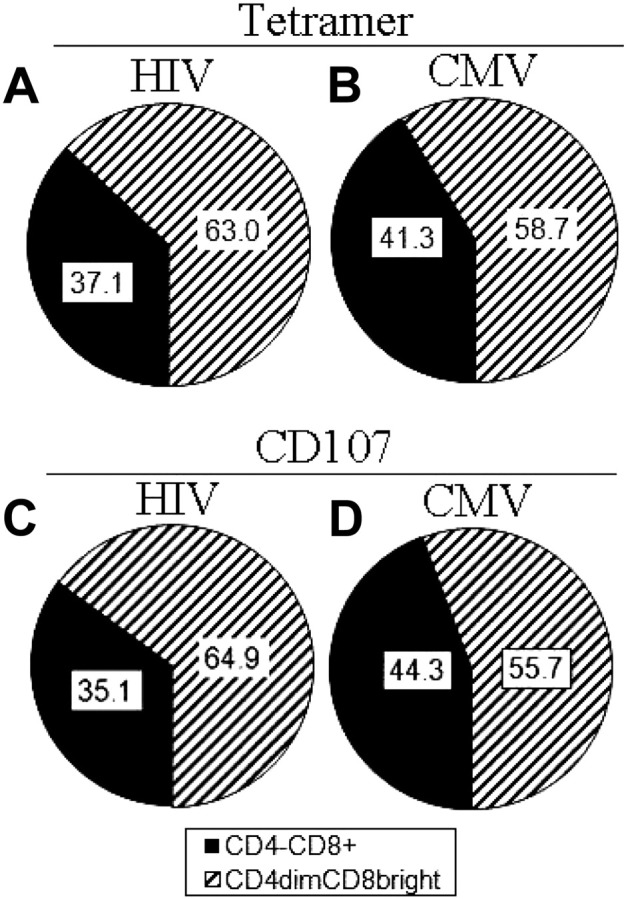
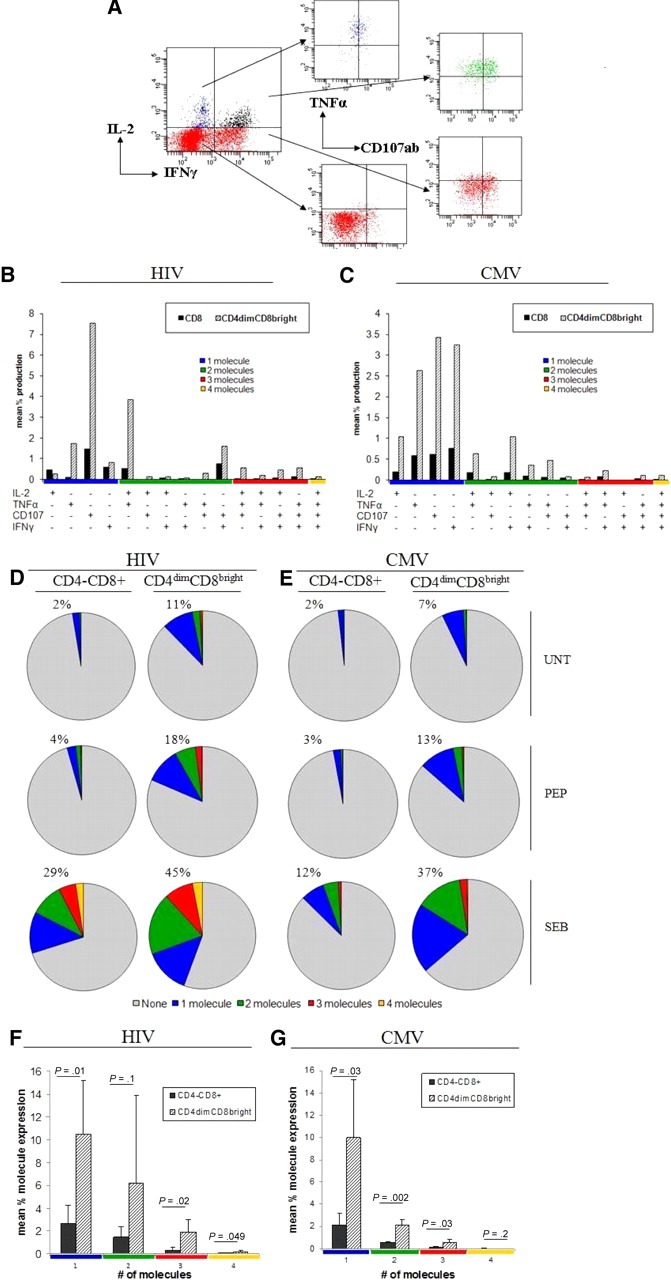
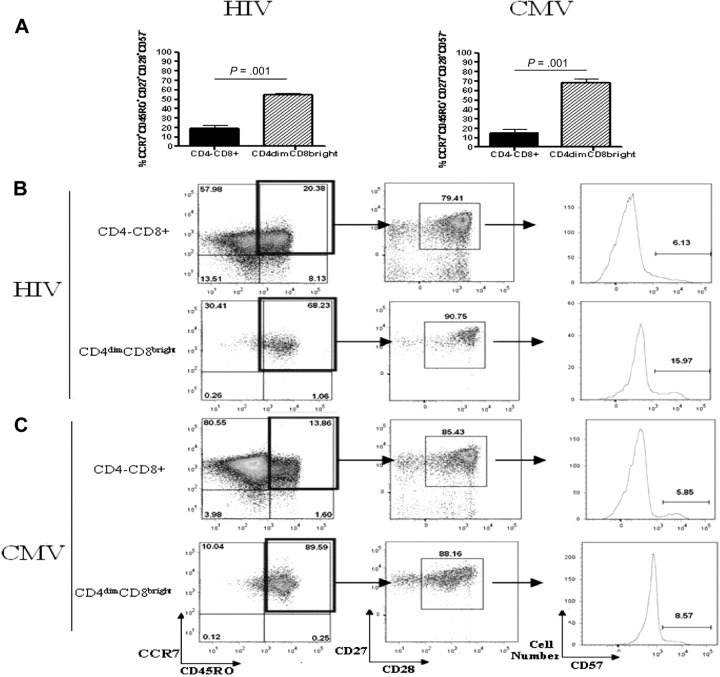
In humans, approximately 3% of peripheral CD8+ T cells coexpress CD4 dimly on their surface and hence are designated as CD4(dim)CD8(bright) T cells. We evaluated the contribution of this CD4(dim)CD8(bright) T-cell population to anti-HIV immunity. We demonstrate that CD4(dim)CD8(bright) T cells generate greater than 55% of CD8+ T-cell antigen recognition and effector response to HIV, as evaluated by multiple parameters for assessing T-cell antiviral immunity, including HIV tetramer recognition, cytokine production, and cytolytic potential. Inhibition of major histocompatibility class II (MHC-II) on target cells or CD4 on CD4(dim)CD8(bright) T cells diminishes their anti-HIV responses, suggesting that CD4 on effector cells and MHC-II on target cells provides an additional arm of contact between effector and target cells which is critical to CD4(dim)CD8(bright) T-cell function. CD4(dim)CD8(bright) T cells also exhibit features that are indicative of central memory T cells. Finally, CD4(dim)CD8(bright) T cells are elevated in blood of HIV+ long-term nonprogressors in comparison to HIV- donors. Collectively, our findings show that CD4(dim)CD8(bright) T cells designate an enriched antiviral subpopulation of CD8+ T cells that should be targeted for therapeutic intervention or evaluation of vaccine efficacy.


Figures

Figure 1
Figure 1
CD4dimCD8bright T cells are a genuine subset of CD8+ T cells. (A-D) Gating strategy for live cells using side scatter area (SSC-A) and Aqua Live/Dead staining (A), followed by gating for singlet cells using forward scatter area (FSC-A) and forward scatter height (FSC-H; B), then for lymphocytes using SSC-A and FSC-A(C), and for T cells using CD3 or CD3 and CD8(D). (E) Gating for CD4CD8+ and CD4dimCD8bright T cells using CD4 and CD8 based on a previous CD3 gate. (F) Representative isotype staining showing gate placement between CD4CD8+ and CD4dimCD8bright T cells. (G-J) Visualization of CD4dimCD8bright T cells by confocal microscopy. PBMCs were immunostained using anti–CD4-PE (red; G) and anti-CD8-FITC (green; H), then coexpression was visualized by overlay (I). (J) Magnification of overlay in panel I. Arrows point to the same cell coexpressing CD4 and CD8 across the panels.
Figure 2
Figure 2
Percentage of expression of CD4dimCD8bright T cells is higher among LTNPs than among HIV seronegative donors. (A-B) Cumulative data (A) and representative dot plots (B) showing CD4 expression on CD8+ T cells obtained from 5 HIV and 8 HIV+ LTNP donors. (A) Horizontal lines represent the mean percentage of CD4dimCD8bright T cells within the CD8+ T-cell population. (C) Cumulative data showing TCRVβ clonotype expression of CD4CD8+ and CD4dimCD8bright T cells from HIV+ LTNP and CMV+ donors. (D-E) Cumulative data showing TCR vβ clonotype expression of HIV+ LTNPs which are significantly increased (D) or decreased (E) between CD4CD8+ and CD4dimCD8bright T cells. Closed squares denote CD4CD8+ T cells and open circles denote CD4dimCD8bright T cells from HIV+ LTNP donors. P values between groups are indicated within the figure and based on 2-tailed unpaired t test analysis.
Figure 3
Figure 3
CD4dimCD8bright T cells recognize antigen more potently than CD4CD8+ T cells. (A,C) Cumulative data of CD4CD8+ and CD4dimCD8bright T cells staining for HIVgag (A) and CMVpp65 (C) tetramers from fresh cells (fresh), untreated cells at day 6 (Unt), or cells stimulated for 6 days with HIV pooled peptide (HIV) or CMVpp65 peptide (CMV) from HIV+ LTNP (A) or CMV+ donors (C). Data represent mean ± SD percentage of expression of tetramer-positive cells from at least 3 donors. P values between groups are indicated within the figure and based on 2-tailed unpaired t test analysis. (B,D) Representative dot plots of HIVgag (B) and CMVpp65 (D) tetramer binding.
Figure 4
Figure 4
CD4dimCD8bright T cells have greater cytotoxic potential than CD4CD8+ T cells. (A-B,D-E) Cumulative data (A,D) and representative dot plots (B,E) of CD107ab staining by CD4CD8+ and CD4dimCD8bright T cells from HIV+ LTNP (A-B) and CMV+ (D-E) donors, cocultured with unloaded (left side) or loaded (right side) T1 target cells. (A,D) Data represent mean + SD percentage of 107ab expression from at least 3 donors. P values between groups are indicated within the figure and based on 2-tailed unpaired t test analysis. (C,F) Representative dot plots of CD4CD8+ (left) and CD4dimCD8bright T cells (right) from an unstained HIV+ LTNP donor (C) and an isotype-stained CMV+ donor (F).
Figure 5
Figure 5
The CD4 molecule contributes to the greater cytotoxic potential of CD4dimCD8bright T cells compared with CD4CD8+ T cells. (A-H) Cumulative data (A,F) and representative dot plots (B-E,G-J) of CD107ab staining by CD4CD8+ and CD4dimCD8bright T cells from HIV+ LTNP (A-E) and CMV+ (F-J) donors, cocultured with T1 target cells with no blocker (A-B,F-G), after blocking targets with MHC-II blocking antibody(A,C,F,H), or CD4 neutralizing antibody (A,D,F,I) or cocultured with T2 targets (A,E,F,J). (A,F) Data represent mean + SD percentage of 107ab expression from at least 3 donors. P values between groups are indicated within the figure and based on 2-tailed unpaired t test analysis.
Figure 6
Figure 6
CD4dimCD8bright T cells are highly enriched for antigen-specific responses in comparison to CD4CD8+ T cells. (A-D) Cumulative data showing percentage of total tetramer binding (antigen recognition; A-B) and total CD107ab staining (cytotoxic potential; C-D) of CD4CD8+ and CD4dimCD8bright T cells from HIV+ LTNP (left) and CMV+ (right) donors. Data are based on at least 3 donors.
Figure 7
Figure 7
CD4dimCD8bright T cells are the polyfunctional CD8+ T-cell population. (A) Representative dot plots for evaluation of polyfunctional responses. The gating strategy in Figure 1A through F was used to arrive at the cumulative data shown here. (B-C) Cumulative data showing effector molecule production on respective antigen priming of CD4CD8+ and CD4dimCD8bright T cells from HIV+ LTNP (B) and CMV+ (C) donors. The x-axis lists the effector molecule or combination produced (production is denoted by +). Responses are grouped and color-coded by the number of effector molecules produced. (D-E) Cumulative data showing the mean percentage of cells producing the respective number of effector molecules with no treatment (UNT), respective peptide treatment (PEP) or SEB treatment. Percentages listed denote total percentage of cells producing one or more molecules (sum of blue, red, green, and orange pies). (F-G) Cumulative data of mean percentage of expression of 1, 2, 3, or 4 molecules in response to HIV(F) or CMV (G) peptide stimulation. P values denote differences between CD4CD8+ and CD4dimCD8bright T-cell cytokine expression as calculated using paired t test analysis.
Figure 8
Figure 8
Most CD4dimCD8bright T cells are central memory T cells. (A) Cumulative data showing mean percentage of CD4CD8+ (left) and CD4dimCD8bright (right) T cells, from HIV+ LTNP (A-B) and CMV+ (A,C) donors, that are central memory (CCR7+CD45RO+CD27+CD28+CD57). (B-C) Representative dot plots showing raw percentages of CD4CD8+ and CD4dimCD8bright T cells from HIV+ LTNP (B) and CMV+ (C) donors staining for memory-associated markers CCR7+CD45RO+ (left), then further gated CD27+CD28+ cells, and finally CD57+ cells. (D-G) Cumulative data (D,F) and representative flow dot plots (E,G) showing the proportion of CD4CD8+ and CD4dimCD8bright T cells from HIV+ LTNP (D-E) and CMV+ (F-G) donor cells that are CFSEdim (decreased CFSE expression and, therefore, increased proliferation) in response to no treatment (UNT), respective peptide treatment (PEP), or SEB treatment. (A,D,F) Data are based on at least 3 donors + SD. P values between groups are indicated within the figure and based on 2-tailed paired t test analysis.
Figure 8
Figure 8
Most CD4dimCD8bright T cells are central memory T cells. (A) Cumulative data showing mean percentage of CD4CD8+ (left) and CD4dimCD8bright (right) T cells, from HIV+ LTNP (A-B) and CMV+ (A,C) donors, that are central memory (CCR7+CD45RO+CD27+CD28+CD57). (B-C) Representative dot plots showing raw percentages of CD4CD8+ and CD4dimCD8bright T cells from HIV+ LTNP (B) and CMV+ (C) donors staining for memory-associated markers CCR7+CD45RO+ (left), then further gated CD27+CD28+ cells, and finally CD57+ cells. (D-G) Cumulative data (D,F) and representative flow dot plots (E,G) showing the proportion of CD4CD8+ and CD4dimCD8bright T cells from HIV+ LTNP (D-E) and CMV+ (F-G) donor cells that are CFSEdim (decreased CFSE expression and, therefore, increased proliferation) in response to no treatment (UNT), respective peptide treatment (PEP), or SEB treatment. (A,D,F) Data are based on at least 3 donors + SD. P values between groups are indicated within the figure and based on 2-tailed paired t test analysis.

References

    1. Ogg GS, Jin X, Bonhoeffer S, et al. Quantitation of HIV-1-specific cytotoxic T lymphocytes and plasma load of viral RNA. Science. 1998;279(5359):2103–2106. - PubMed
    1. Mackewicz CE, Ortega HW, Levy JA. CD8+ cell anti-HIV activity correlates with the clinical state of the infected individual. J Clin Invest. 1991;87(4):1462–1466. - PMC - PubMed
    1. Betts MR, Nason MC, West SM, et al. HIV nonprogressors preferentially maintain highly functional HIV-specific CD8+ T cells. Blood. 2006;107(12):4781–4789. - PMC - PubMed
    1. Sullivan YB, Landay AL, Zack JA, Kitchen SG, Al-Harthi L. Upregulation of CD4 on CD8+ T cells: CD4dimCD8bright T cells constitute an activated phenotype of CD8+ T cells. Immunology. 2001;103(3):270–280. - PMC - PubMed
    1. Zloza A, Sullivan YB, Connick E, Landay AL, Al-Harthi L. CD8+ T cells that express CD4 on their surface (CD4dimCD8bright T cells) recognize an antigen-specific target, are detected in vivo, and can be productively infected by T-tropic HIV. Blood. 2003;102(6):2156–2164. - PubMed

Publication types