. 2009 Sep;175(3):1066-76.
doi: 10.2353/ajpath.2009.090071. Epub 2009 Aug 21.

Intestinal glucose uptake protects liver from lipopolysaccharide and D-galactosamine, acetaminophen, and alpha-amanitin in mice

Affiliations

Intestinal glucose uptake protects liver from lipopolysaccharide and D-galactosamine, acetaminophen, and alpha-amanitin in mice

Laura Zanobbio et al. Am J Pathol. 2009 Sep.

Abstract

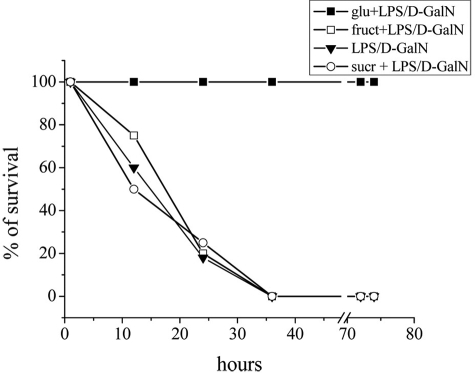
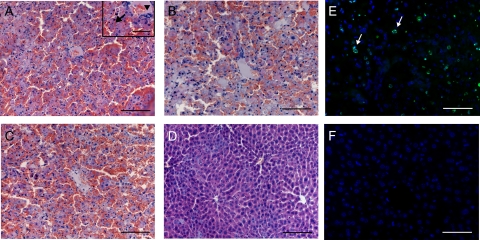
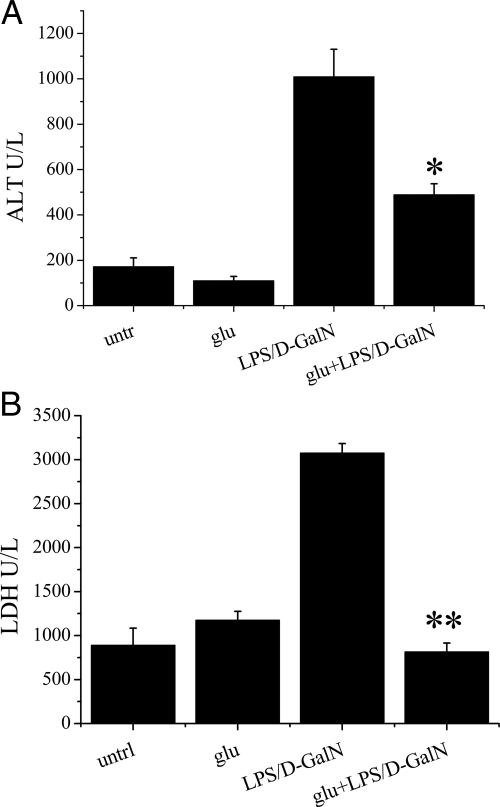
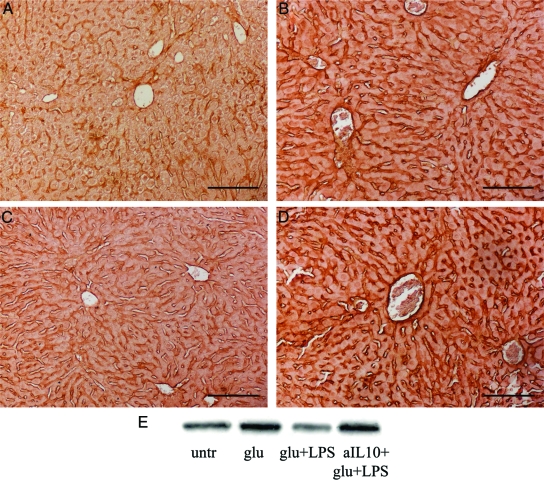
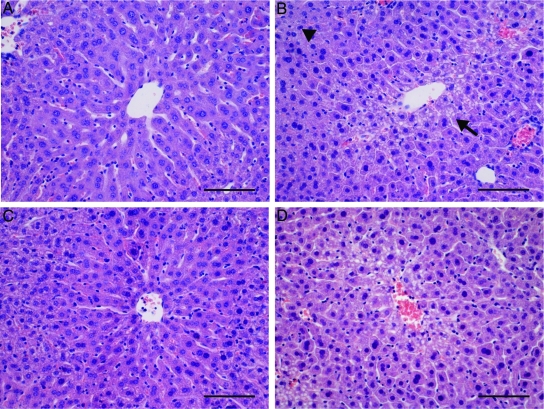
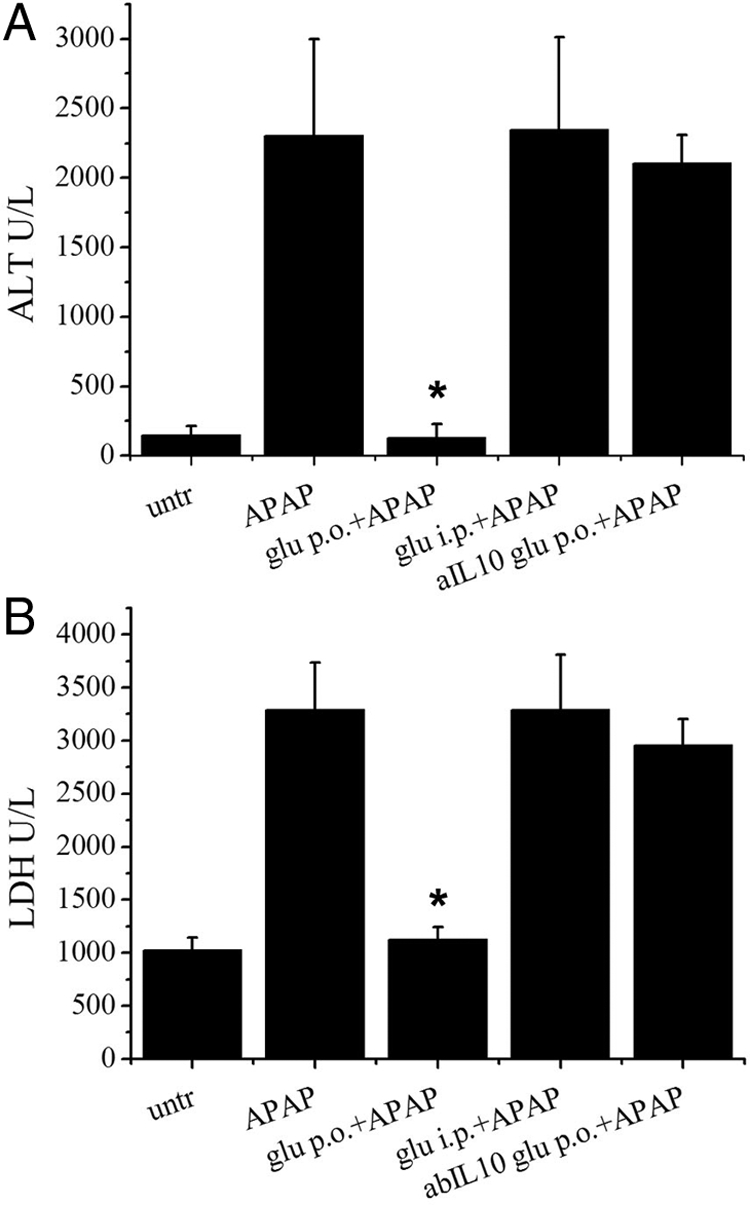
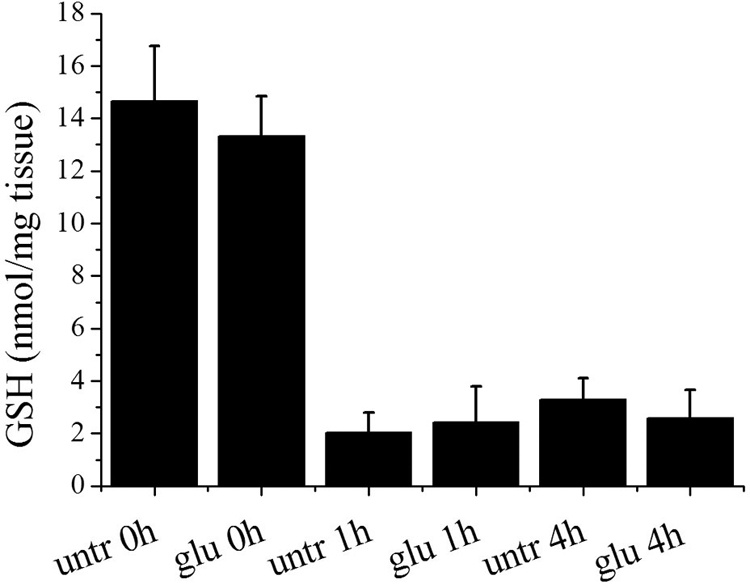
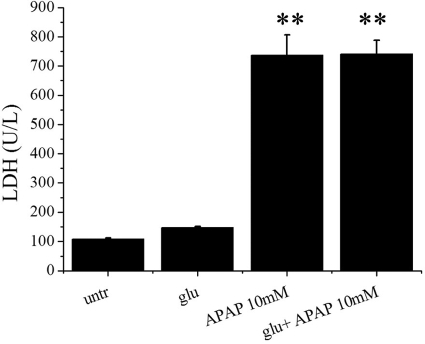
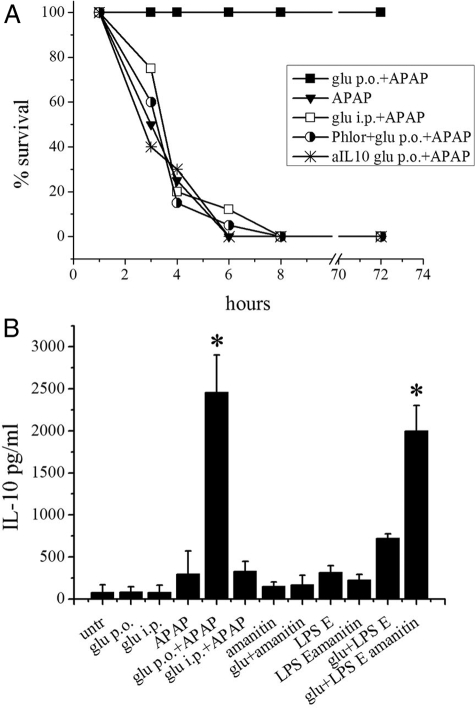
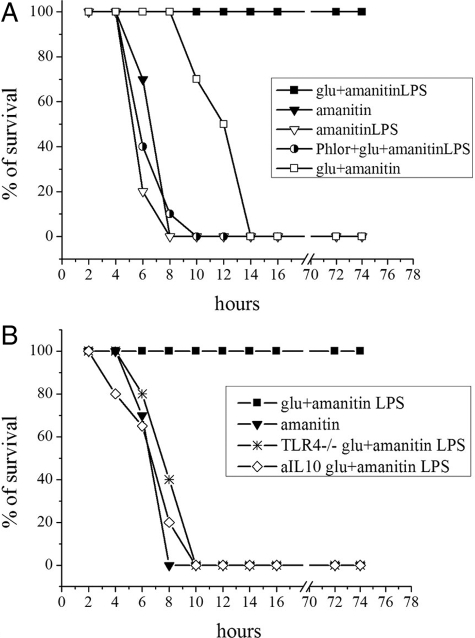
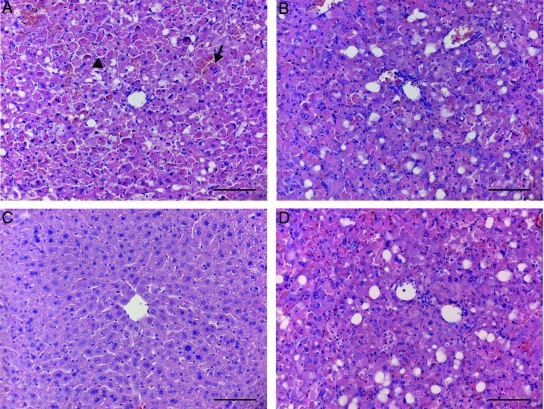
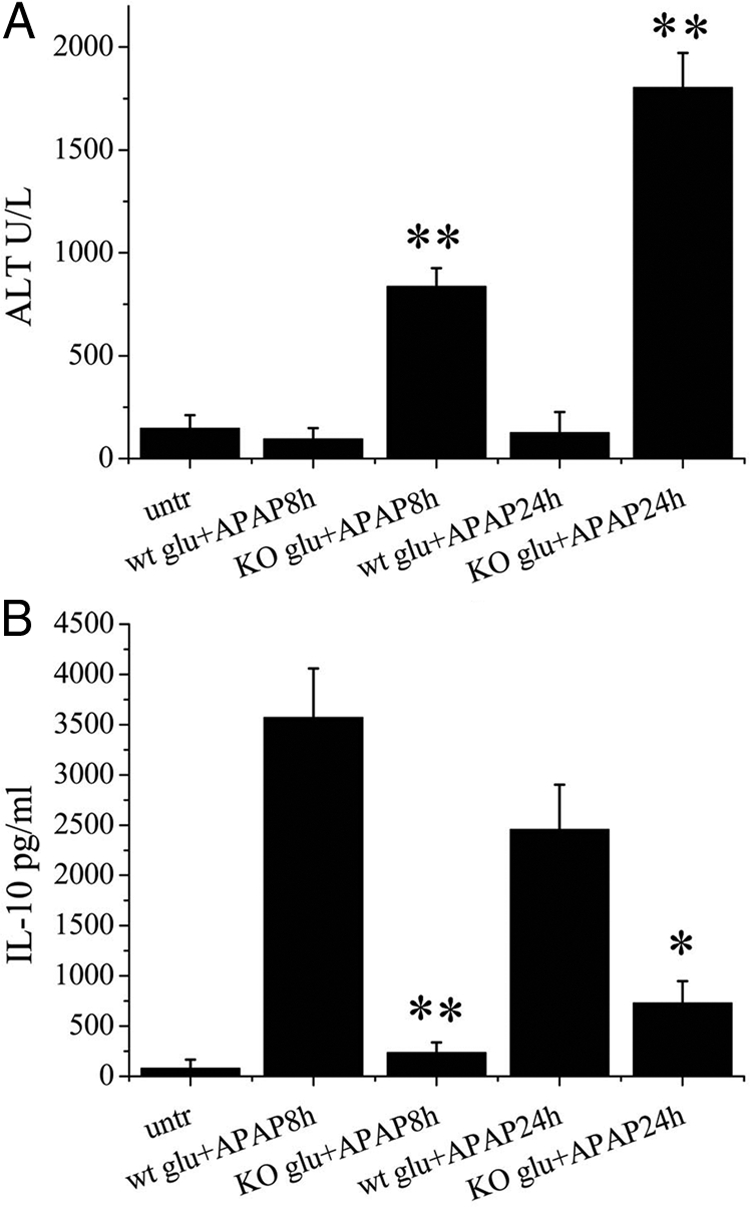
We have recently observed that oral administration of D-glucose saves animals from lipopolysaccharide (LPS)-induced death. This effect is the likely consequence of glucose-induced activation of the sodium-dependent glucose transporter-1. In this study, we investigated possible hepatoprotective effects of glucose-induced, sodium-dependent, glucose transporter-1 activation. We show that oral administration of D-glucose, but not of either D-fructose or sucrose, prevents LPS-induced liver injury, as well as liver injury and death induced by an overdose of acetaminophen. In both of these models, physiological liver morphology is maintained and organ protection is confirmed by unchanged levels of the circulating markers of hepatotoxicity, such as alanine transaminase or lactate dehydrogenase. In addition, D-glucose was found to protect the liver from alpha-amanitin-induced liver injury. In this case, in contrast to the previously described models, a second signal had to be present in addition to glucose to achieve protective efficacy. Toll-like receptor 4 stimulation that was induced by low doses of LPS was identified as such a second signal. Eventually, the protective effect of orally administered glucose on liver injury induced by LPS, overdose of acetaminophen, or alpha-amanitin was shown to be mediated by the anti-inflammatory cytokine interleukin-10. These findings, showing glucose-induced protective effects in several animal models of liver injury, might be relevant in view of possible therapeutic interventions against different forms of acute hepatic injury.


Figures

Figure 1
Figure 1
Plot of the percentage of survivors over time among mice injected i.p. with lipopolysaccharide and d-galactosamine (LPS/d-GalN). Mice were pretreated with d-glucose (closed square), d-fructose (open square), sucrose (open circle), or saline (closed triangle) 1 hour before LPS/d-GalN administration. Experimental group consisted of 10 mice.
Figure 2
Figure 2
Histology of liver tissue after lipopolysaccharide and d-galactosamine (LPS/d-GalN) administration. Liver sections were stained with H&E. Liver sections from LPS/d-GalN-treated animals show acute hepatitis (A) with important hemorrhagic necrosis. In the box are shown apoptotic bodies (arrow) and infiltration of inflammatory cells in the portal area (arrowhead). The histological changes caused by LPS/d-GalN are still present in fructose- (B) or sucrose-(C) treated mice, but absent in d-glucose-treated animals (D). Scale bar = 40 μm; box = 15 μm. E–F: TUNEL assay. In the liver of mice receiving LPS/d-GalN numerous apoptotic cells are detected (arrows) (E), whereas in animals treated with d-glucose before LPS/d-GalN administration the staining for apoptotic nuclei is negative (F). Scale bar = 20 μm.
Figure 3
Figure 3
ALT (A) and LDH (B) plasma levels induced by lipopolysaccharide and d-galactosamine (LPS/d-GalN) at 6 hours after treatment. Data are the means (± SD) of two independent experiments (3 mice/group). Untr = untreated mice; glu = mice treated with d-glucose; LPS/d-GalN = mice treated only with LPS/d-GalN and glu+LPS/d-GalN = mice treated with d-glucose and after 1 hour with LPS/d-GalN (*P < 0.05, **P < 0.005 glu+LPS/d-GalN versus LPS/d-GalN).
Figure 4
Figure 4
ICAM-1 liver expression. Expression of ICAM-1 was examined by immunohistochemistry (A–D) and by Western blot analysis (E). Immunohistochemistry shows a faint constitutive ICAM-1 expression, restricted to hepatic sinusoids in control animals (A), LPS/d-GalN injection results in a massive induction of ICAM-1 (B) while oral d-glucose administration reduced the toxin-induced up-regulation of the protein (C), but fails when administered together with IL-10-neutralizing antibodies (D). Scale bar = 40 μm. Western blot analysis on protein extracts from the liver of same animals confirms the results (E).
Figure 5
Figure 5
Histology of liver tissue after acetaminophen (APAP) treatment with or without pretreatment with per os d-glucose. Liver sections, stained with H&E, from animals treated with APAP (B) show hepatocyte cytoplasmic vacuolization (arrow), fatty degeneration and constipation (arrowhead) in comparison with untreated mice (A). Liver of animals treated with d-glucose (C) maintains its physiological morphology, while pathological alterations remain evident when d-glucose is administered with IL-10 neutralizing antibodies (D). Scale bar = 40 μm.
Figure 6
Figure 6
Determination of ALT (A) and LDH (B) levels in acetaminophen (APAP)-treated mice. Data are the means (± SD) of two independent experiments (3 mice/group). Untr = untreated mice; APAP = mice treated only with APAP, glu p.o.+APAP = mice orally treated with d-glucose and after 1 hour with APAP, glu i.p.+APAP = mice intraperitoneally treated with d-glucose plus APAP; abIL10 glu p.o.+APAP = mice treated with IL-10 neutralizing antibodies and d-glucose before APAP administration (*P < 0.05 glu+APAP versus APAP).
Figure 7
Figure 7
Determination of hepatic GSH concentration in APAP-challenge mice. Untreated mice (untr) or d-glucose-treated mice (glu) were challenged with APAP. Liver tissues from groups of three mice at the indicated times after APAP challenge were harvested, and hepatic GSH levels were measured.
Figure 8
Figure 8
Cytotoxicity of APAP in primary mouse hepatocytes. Mouse primary hepatocytes were treated with APAP (10 mmol/L) with or without d-glucose (10 g/L) for 24 hours. Treatment was started after 24 hours of seeding and LDH release in culture medium is measured 24 hours after APAP-treatment. Mean ± SD (n = 3). All experiments were performed with hepatocytes from three independent preparations (**P < 0.005 APAP and glu+APAP versus untr).
Figure 9
Figure 9
A: Plot of the percentage of survivors over time among mice injected i.p. with APAP. Mice were pretreated with saline (closed triangle), d-glucose orally (closed square) or intraperitoneally (open square) administered, phoridzin plus d-glucose (half-filled circle) or IL-10 neutralizing antibodies plus d-glucose (asterisk), 1 hour before APAP administration. Experimental group consisted of 10 mice. B: Determination of IL-10 plasma levels. Plasma samples were assayed for IL-10 levels by enzyme-linked immunosorbent assay. Values represent the mean ± SD (5 mice) (*P < 0.05 glu p.o.+APAP versus APAP and glu+LPS E amanitin versus amanitin).
Figure 10
Figure 10
Plot of the percentage of survivors over time among mice injected i.p. with α-amanitin. A: Mice were pretreated with saline and injected with α-amanitin (closed triangle) or with α-amanitin plus LPS (open triangle) and pretreated with d-glucose before α-amanitin (open square) or α-amanitin plus LPS administration (wild-type mice: closed square). Mice treated with phloridzin before α-amanitin plus LPS administration (split circle). B: TLR4 KO mice: asterisk; open diamond: pretreatment of mice with neutralizing IL-10 antibodies. Experimental group consisted of 10 mice.
Figure 11
Figure 11
Histology of liver tissue after α-amanitin treatment. Sections from livers of α-amanitin treated mice show extended fatty degeneration (arrowhead) and necrosis (arrow) (A) and the same hepatic pathological alterations affect tissues from mice pretreated with d-glucose (B). When d-glucose treatment is followed by administration of α-amanitin plus a sublethal LPS dose, the liver maintains its normal morphology (C), whereas pathological alterations remain evident when d-glucose is administered with IL-10 neutralizing antibodies (D). Scale bar = 40 μm.
Figure 12
Figure 12
A: ALT levels in TLR4−/− mice. Wild-type (wt) or TLR4−/− (KO) mice were pretreated with per os d-glucose and after 1hour with acetaminophen (APAP). Plasma samples were collected after 8 and 24 hours and assayed for ALT activity. Data are the means (± SD) of two independent experiments performed in triplicate. B: IL-10 serum levels. Mice were pretreated with per os d-glucose and after 1 hour with APAP. Samples were collected after 8 and 24 hours and were assayed for IL-10 levels by enzyme-linked immunosorbent assay. Values represent the mean ± SD (*P < 0.05 and **P < 0.01 KO glu+APAP versus wt glu+APAP).

Similar articles

Cited by

References

    1. Schiodt FV, Antillasoy E, Shakil AO, Schiff ER, Caldwell C, Kowdley KV, Stibling R, Crippin JS, Flamm S, Somberg KA, Rosen H, McCashland TM, Hay JE, Lee WM. Etiology and outcome for 295 patients with acute liver failure in the United States. Liver Transpl Surg. 1999;5:29–34. - PubMed
    1. Dass M, Plevak DJ, Wijdicks EF, Rakela J, Wiesner RH, Piepgras DG, Dunn WF, Steers JL. Acute liver failure: results of a 5-year clinical protocol. Liver Transpl Surg. 1995;1:210–219. - PubMed
    1. O'Grady JG. Acute liver failure. Postgrad Med J. 2005;81:148–154. - PMC - PubMed
    1. Luedde T, Trautwein C. Intracellular survival pathways in the liver. Liver Int. 2006;26:1163–1174. - PubMed
    1. Palazzo M, Gariboldi S, Zanobbio L, Selleri S, Dusio GF, Mauro V, Rossini A, Balsari A, Rumio C. SGLT-1 as a novel immunological player in the intestinal mucosa. J Immunol. 2008;181:3126–3136. - PubMed

MeSH terms