. 2009 Oct 16;284(42):28729-37.
doi: 10.1074/jbc.M109.016840. Epub 2009 Aug 21.

GATA3 is selectively expressed in the trophectoderm of peri-implantation embryo and directly regulates Cdx2 gene expression

Affiliations

GATA3 is selectively expressed in the trophectoderm of peri-implantation embryo and directly regulates Cdx2 gene expression

Pratik Home et al. J Biol Chem. .

Abstract

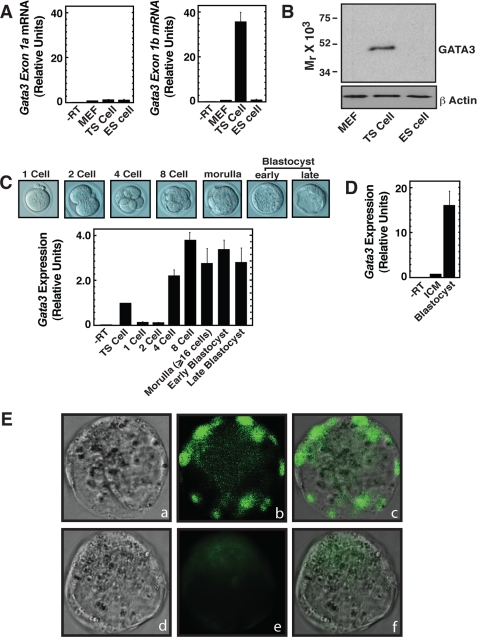
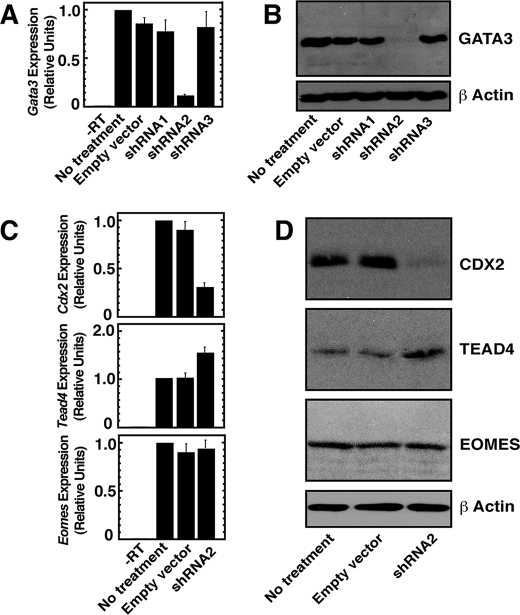
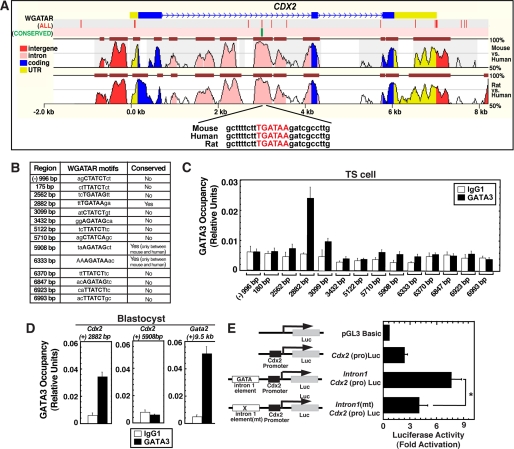
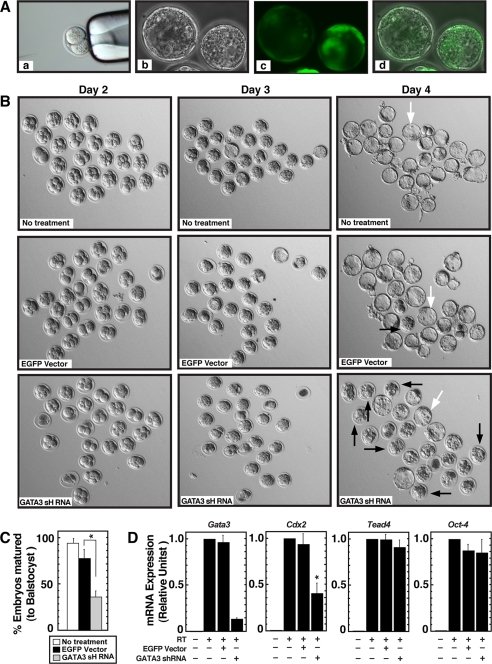
During early mammalian development, genesis of the first two cell lineages, inner cell mass (ICM) and trophectoderm (TE), is dependent upon functions of key transcription factors that are expressed in a regulated and spatially restricted fashion. In this study, we demonstrate that during early mouse development, mRNA expression of transcription factor GATA3 is induced at the 4-cell stage and is consistently present during pre-implantation embryonic development. Interestingly, at the blastocyst stage, Gata3 mRNA is selectively up-regulated within the TE lineage, and GATA3 protein is abundantly present only in the TE but not in the ICM. Using mouse trophoblast stem cells (TS cells) as a model, we found that, knockdown of GATA3 by RNA interference (RNAi) down-regulates expression of caudal-type homeobox 2 (CDX2), a key regulator of the TE lineage. Chromatin immunoprecipitation (ChIP) analyses revealed that, in TS cells, GATA3 directly regulates Cdx2 transcription from a conserved GATA motif at the intron 1 region of the Cdx2 locus. ChIP analyses with mouse blastocysts also detected GATA3 occupancy at intron 1 of the Cdx2 locus. In addition, down-regulation of GATA3 in pre-implantation mouse embryos reduces Cdx2 expression and inhibits morula to blastocyst transformation. Our results indicate a novel function of GATA3, in which it is selectively expressed in TE, regulates expression of key genes in TE lineage, and is involved in morula to blastocyst transformation.


Figures

FIGURE 1.
FIGURE 1.
GATA3 is selectively expressed in the TE of blastocyst. A, quantitative RT-PCR analysis of Gata3 transcripts with exon-specific primers (means ± S.E., three independent experiments). Graphs show Gata3 transcript levels with respect to that in MEF (used as negative control). B, Western blot analysis showing GATA3 protein in cells analyzed in A. C, different stages of early mouse embryo (top) that are analyzed by quantitative RT-PCR analysis (bottom) for Gata3 mRNA expression. The graph shows the relative Gata3 mRNA levels in pre-implantation embryos with respect to that in mouse TS cells (means ± S.E., three independent experiments). D, quantitative RT-PCR analysis showing the relative Gata3 mRNA levels in whole blastocyst with respect to that in ICM (means ± S.E., three independent experiments). E, localization of GATA3 protein at the early blastocyst stage as observed by immunofluorescence microscopy; a and d, phase contrast images of early blastocysts. b and e, fluorescence images after incubating blastocysts with anti-GATA3 antibody or only with the secondary antibody in the absence of anti-GATA3 antibody, respectively. c and f, merged fluorescence and phase-contrast images.
FIGURE 2.
FIGURE 2.
GATA3 positively regulates Cdx2 expression in TS cells. A, quantitative RT-PCR analysis of Gata3 mRNA expression in TS cells, expressing shRNAs against Gata3 (means ± S.E., three independent experiments). Cells were infected with lentiviral vectors expressing shRNAs and analyzed as mentioned under “Experimental Procedures.” TS cells, without any treatment or infected only with empty vectors, were used as control. B, Western blot analysis of GATA3 protein expression in cells analyzed in A. C, quantitative RT-PCR analysis of Cdx2, Tead4, and Eomes in GATA3-knocked down TS cells (means ± S.E., three independent experiments). D, Western blot analysis of samples analyzed in C.
FIGURE 3.
FIGURE 3.
GATA3 directly regulates Cdx2 expression in blastocysts by occupying a conserved GATA motif within intron 1 of the Cdx2 gene. A, alignment of ∼10 kb regions of mouse, human, and rat Cdx2 loci showing the presence of a conserved GATA motif at the Cdx2 intron 1 region. The red vertical bars on top indicate positions of all WGATAR motifs, and the green bar indicates the position of the conserved WGATAR motif in the ∼10-kb region of the mouse Cdx2 locus. B, table shows the coordinates of WGATAR motifs in the mouse Cdx2 locus. C, quantitative ChIP analysis showing GATA3 occupancy at the (+)2882-bp conserved WGATAR motif, located within intron 1 of the Cdx2 locus, in mouse TS cells (means ± S.E., four independent experiments). D, ChIP analysis showing that GATA3 occupies the conserved WGATAR motif of the Cdx2 intron 1 region in blastocysts but not at the GATA motif (5908 bp) of Cdx2 3′-UTR (means ± S.E., three independent experiments). Gata2 (+) 9.5-kb region was used as a positive GATA3 binding site. E, mouse TS cells were transiently transfected with plasmids in which the Cdx2 intron 1 element was fused to the Cdx2 promoter in front of a luciferase (Luc) reporter gene. In Intron1(mt)Cdx2(pro)Luc construct the conserved WGATAR motif was mutated. Plots depict luciferase activity of the cell lysates normalized by the protein concentration of the lysates (mean ± S.E., four independent experiments; *, p < 0.05). In each independent experiment, transfections were performed in triplicate.
FIGURE 4.
FIGURE 4.
Inhibition of morula to blastocyst transformation in GATA3-depleted pre-implantation embryos. A, 2-cell mouse embryos were subjected to pronuclear injection (panel a) with lentiviral constructs expressing EGFP under the control of the phosphoglycerate kinase promoter. Embryos were cultured for 3 days, and images were captured under phase (panel b) or fluorescence (panel c) microscopy. Panel d shows merged phase and fluorescence images. B, 2-cell mouse embryos (25 embryos for each experimental set) were injected with EGFP-expressing (panels in middle row) or GATA3 shRNA-expressing (panels in bottom row) lentiviral constructs, pre-implantation embryonic development was monitored after 24 h (day 2 of development), 48 h (day 3 of development), and 72 h (day 4 of development), and compared with untreated embryos (panels of top row). Four independent experiments were performed, and representative pictures for each condition are shown. No significant defect is apparent in the development of GATA3 shRNA-expressing embryos up to day 3 of development. Most of the embryos developed to the morula stage. However, at day 4, development of the majority of GATA3 shRNA-expressing embryos was arrested at the morula stage (black arrows), whereas most of the untreated and EGFP-expressing embryos formed matured blastocysts (white arrows). C, graph shows the % total embryos (mean ± S.E., three independent experiments; *, p < 0.05) that formed matured blastocysts at day 4 of development under each experimental condition described in B. D, quantitative RT-PCR analysis of Gata3, Cdx2, Tead4, and Oct-4 mRNA expression in embryos analyzed in C (means ± S.E., *, p < 0.05).

Similar articles

Cited by

References

    1. Rossant J. (2004) Semin. Cell Dev. Biol. 15, 573–581 - PubMed
    1. Zernicka-Goetz M. (2005) Nat. Rev. Mol. Cell Biol. 6, 919–928 - PubMed
    1. Kunath T., Strumpf D., Rossant J. (2004) Placenta 25, Suppl. A, S32–S38 - PubMed
    1. Chawengsaksophak K., James R., Hammond V. E., Köntgen F., Beck F. (1997) Nature 386, 84–87 - PubMed
    1. Strumpf D., Mao C. A., Yamanaka Y., Ralston A., Chawengsaksophak K., Beck F., Rossant J. (2005) Development 132, 2093–2102 - PubMed

Publication types