. 2009 Oct;5(10):734-42.
doi: 10.1038/nchembio.206. Epub 2009 Aug 23.

Sustained cyclic AMP production by parathyroid hormone receptor endocytosis

Affiliations

Sustained cyclic AMP production by parathyroid hormone receptor endocytosis

Sébastien Ferrandon et al. Nat Chem Biol. 2009 Oct.

Abstract

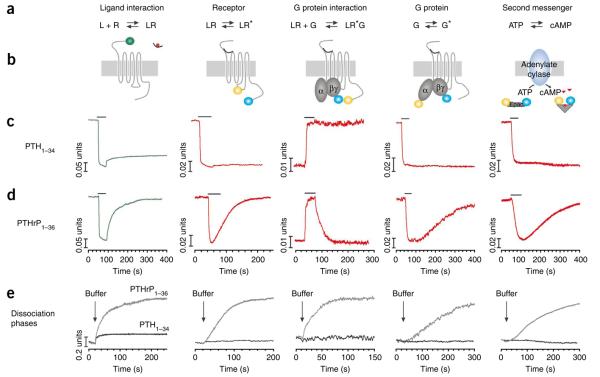
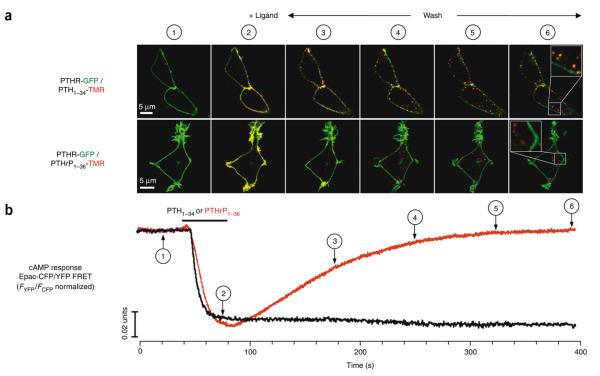
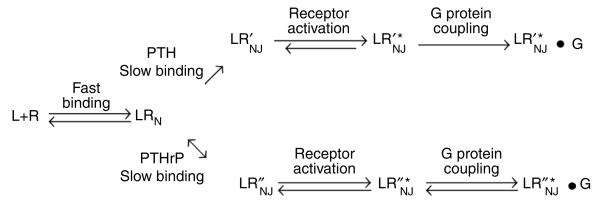
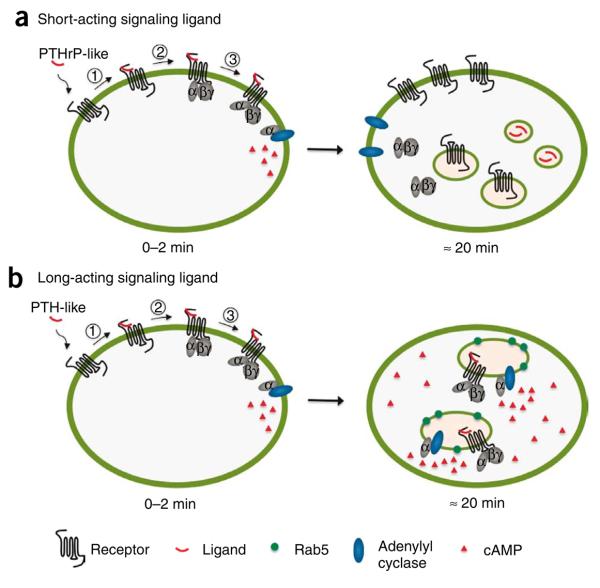
Cell signaling mediated by the G protein-coupled parathyroid hormone receptor type 1 (PTHR) is fundamental to bone and kidney physiology. It has been unclear how the two ligand systems--PTH, endocrine and homeostatic, and PTH-related peptide (PTHrP), paracrine--can effectively operate with only one receptor and trigger different durations of the cAMP responses. Here we analyze the ligand response by measuring the kinetics of activation and deactivation for each individual reaction step along the PTHR signaling cascade. We found that during the time frame of G protein coupling and cAMP production, PTHrP(1-36) action was restricted to the cell surface, whereas PTH(1-34) had moved to internalized compartments where it remained associated with the PTHR and Galpha(s), potentially as a persistent and active ternary complex. Such marked differences suggest a mechanism by which PTH and PTHrP induce differential responses, and these results indicate that the central tenet that cAMP production originates exclusively at the cell membrane must be revised.


Figures

Figure 1
Figure 1
Time courses of early reactions in the signaling cascade of PTHR. (a) Biochemical reactions under study. (b) Experimental approaches for FRET measurements of the different kinetic events. (c,d) Time courses of distinct reactions mediated by PTH1–34 (c) and PTHrP1–36 (d) at a saturating concentration. Measurements were performed in single HEK293 cells continuously perfused with buffer or briefly perfused with ligand for the time indicated by the horizontal bar. For binding, the trace represents changes in emission of GFP fluorescence normalized to the initial value. For the other events, traces represent the normalized FRET ratio FYFP/FCFP calculated according to equation (1). Traces are representative of n > 10 independent experiments. (e) Comparison of time courses of ligand dissociation, PTHR deactivation, PTHR and Gs dissociation, Gs deactivation and cAMP degradation upon removal of ligands by washout. Data from the time course of experiments are like those in b and c.
Figure 2
Figure 2
Coupling, activation and trafficking of Gs proteins. (a) Kinetics of PTHR-Gs interaction. HEK293 cells were transfected with an increasing amount of CFP-labeled Gγ2 in combination with Gβ1 and Gαs, and with a fixed amount of PTHR-YFP cDNAs. To ensure that relative levels of receptor and G proteins varied in examined cells, we performed experiments in cells displaying different ratios of YFP and CFP fluorescence emission as an indicator of the relative PTHR-YFP and Gαs-YFP expression levels. Western blots of lysates from transfected cells verified the varying level of Gα and Gγ expressions. Loading was controlled by detection of β-actin (n = 4). (b) Relationship between the observed time constant τ and agonist concentration. Values were obtained from fitting the time course of PTHR-GS interaction as shown in Figure 1. Data represent the mean ± s.e.m. of n > 5 experiments. (c,d) HEK293 cells stably expressing PTHR and transiently transfected with cDNAs encoding Gαs-GFP, Gβ1 and Gγ2 were perfused with PTH1–34-TMR (c) or PTHrP1–36-TMR (d) for 10–20 s and then rapidly washed out by buffer. Upon PTH1–34-TMR wash, co-localization between PTH1–34-TMR and GαS-GFP persisted over a period of 30 min in endosomes but not at the cell surface (c). In contrast, after cell wash, only ligand-containing vesicles are observed in the case of PTHrP1–36-TMR-activated Gαs (d). Pearson's correlation coefficients r ± s.d. (n = 30) at 30 min are 0.800 ± 0.019 for PTH1–34 and 0.034 ± 0.057 for PTHrP1–36. Individual channel data are shown in Supplementary Figure 6.
Figure 3
Figure 3
PTHR endocytosis and cAMP responses mediated by PTH1–34 and PTHrP1–36. (a) Trafficking of TMR-labeled ligands and GFP-N-PTHR were monitored in live HEK293 cells by spinning disc confocal microscopy. PTH1–34-TMR or PTHrP1–36-TMR co-localized with GFP-N-PTHR at the time of injection. Fluorescence micrographs in a showed that upon ligand wash, PTH1–34-TMR (red) and GFP-N-PTHR (green) co-localized (yellow) and remained closely associated during receptor internalization (bottom panels). In contrast, PTHrP1–36-TMR alone is detected as small puntae at internalized sites. Pearson's correlation coefficients r ± s.d. (n = 30) are 0.767 ± 0.030 for PTH1−34 and 0.060 ± 0.090 for PTHrP1−36. Individual channel data are shown in Supplementary Figure 6. (b) TMR-labeled or unlabeled ligands (100 nM) were added by perfusion for about 30 s (horizontal bars); numbers 1–6 correlate live cells spinning disc microscopy and FRET time points for cAMP induction as measured by FRET changes in the Epac-CFP/YFP. Cells were HEK293 stably expressing GFP-N-PTHR alone (a) or coexpressing PTHR and Epac-CFP/YFP (b). The recording is representative of n > 10 experiments.
Scheme 1
Scheme 1
A hypothesis for PTH and PTHrP signaling. L is the ligand; R is the PTHR; LRN is a low-affinity complex between the ligand and the PTHR N domain; LR′NJ and LR″NJ are high-affinity complexes formed by PTH and PTHrP, respectively, and involving interactions to both the N and J domains of the PTHR; LR′*NJ and LR″*NJ are the active receptor states stabilized by PTH and PTHrP, respectively; and LR′*NJ•G and LR″*NJ•G represent distinct high-affinity complexes coupled to a G protein.
Figure 4
Figure 4
PTHR endocytosis and prolonged cAMP responses. (a) HEK293 cells stably expressing GFP-N-PTHR (upper panels) and transfected with Dyn K44A (lower panels) were perfused with s100 nM PTH1–34-TMR for about 20 s and then with buffer alone for the remainder of the experiment. 20 min after ligand exposure and washout, PTH1–34-TMR and GFP-N-PTHR complexes redistributed in endosomes in control cells, but remained exclusively localized at the plasma membrane of Dyn K44A-expressing cells. Scale bars, 5 μm. (b) Averaged cAMP response over a 50-min time course measured by FRET changes from HEK293 cells stably expressing PTHR and transiently expressing Epac-CFP/YFP with or without Dyn K44A. Cells were continuously perfused with control buffer or 100 nM PTH1–34 (arrow). Data represent the mean ± s.e.m. of n = 9. (c) Bars represent the average cAMP response. In these experiments, the ligand was washed out 20 s after application by perfusion to remove the unbound ligand.
Figure 5
Figure 5
Mode of activation of the PTHR by long-acting and short-acting signaling ligands. (a) The action of a short-acting signaling ligand is well represented by the classical model for G protein signaling. The ligand interacts first with the receptor (1). The receptor is then switched on to lead to G protein recruitment (2) and activation (3), which in turn initiates adenylyl cyclase activation. In the classical model—that is, the PTHrP-like hormone model—the ligand rapidly dissociates from the receptor, which deactivates and ultimately terminates the signaling. Receptor and ligand traffic through distinct compartments and pathways. (b) In our model of long-acting signaling ligand, the hormone interacts tightly with the receptor in a conformationally dependent manner. The receptor is then locked into a prolonged active state inducing sustained receptor–G protein coupling and sustained G protein activation. The ternary ligand–receptor–G protein heterocomplex is preserved during its internalization in Rab5-containing endosomes and persists over time to appear as a key structure in the prolonged downstream signaling of PTH-like hormone.

Comment in

References

    1. Lamb TD. Gain and kinetics of activation in the G-protein cascade of phototransduction. Proc. Natl. Acad. Sci. USA. 1996;93:566–570. - PMC - PubMed
    1. Lohse MJ, et al. Optical techniques to analyze real-time activation and signaling of G-protein-coupled receptors. Trends Pharmacol. Sci. 2008;29:159–165. - PubMed
    1. Pierce KL, Premont RT, Lefkowitz RJ. Seven-transmembrane receptors. Nat. Rev. Mol. Cell Biol. 2002;3:639–650. - PubMed
    1. Pugh EN, Jr., Lamb TD. Amplification and kinetics of the activation steps in phototransduction. Biochim. Biophys. Acta. 1993;1141:111–149. - PubMed
    1. Drake MT, Shenoy SK, Lefkowitz RJ. Trafficking of G protein-coupled receptors. Circ. Res. 2006;99:570–582. - PubMed

Publication types

MeSH terms