. 2009 Sep;11(9):1135-42.
doi: 10.1038/ncb1928. Epub 2009 Aug 23.

p53 isoforms Delta133p53 and p53beta are endogenous regulators of replicative cellular senescence

Affiliations

p53 isoforms Delta133p53 and p53beta are endogenous regulators of replicative cellular senescence

Kaori Fujita et al. Nat Cell Biol. 2009 Sep.

Abstract

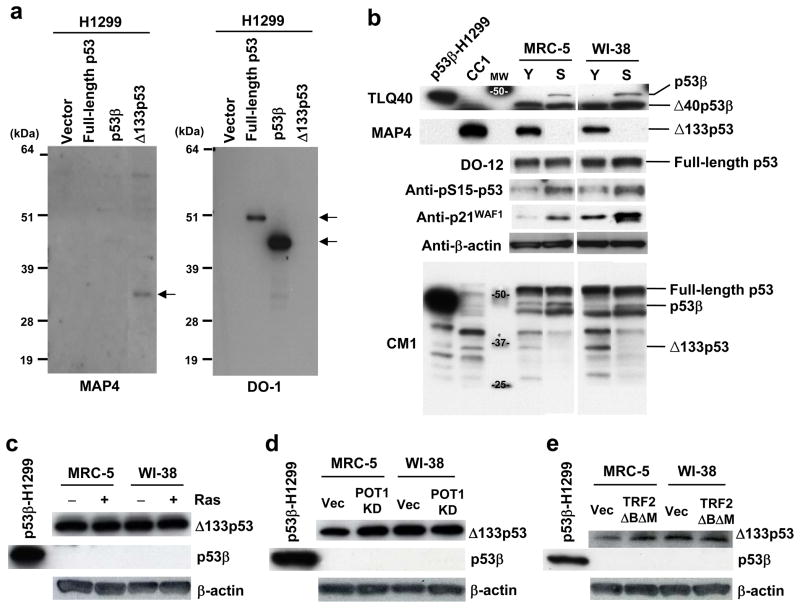
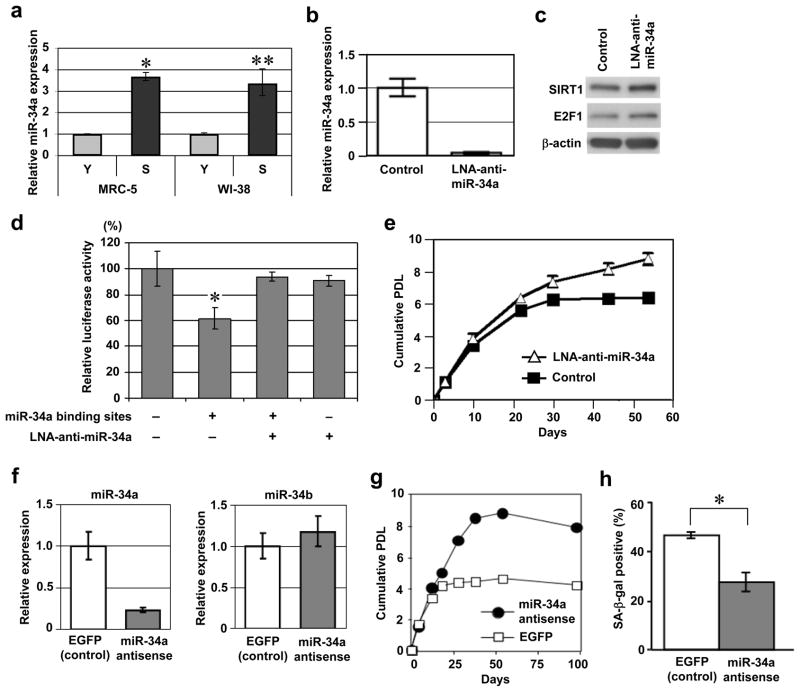
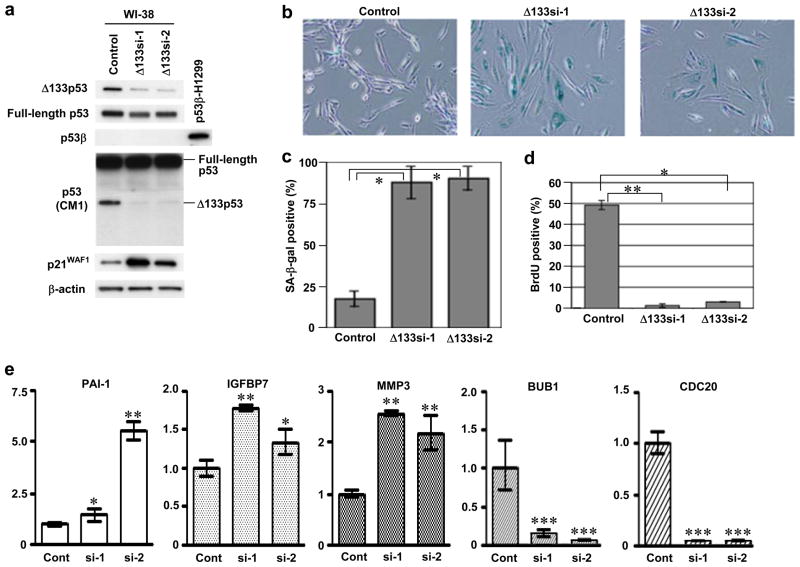
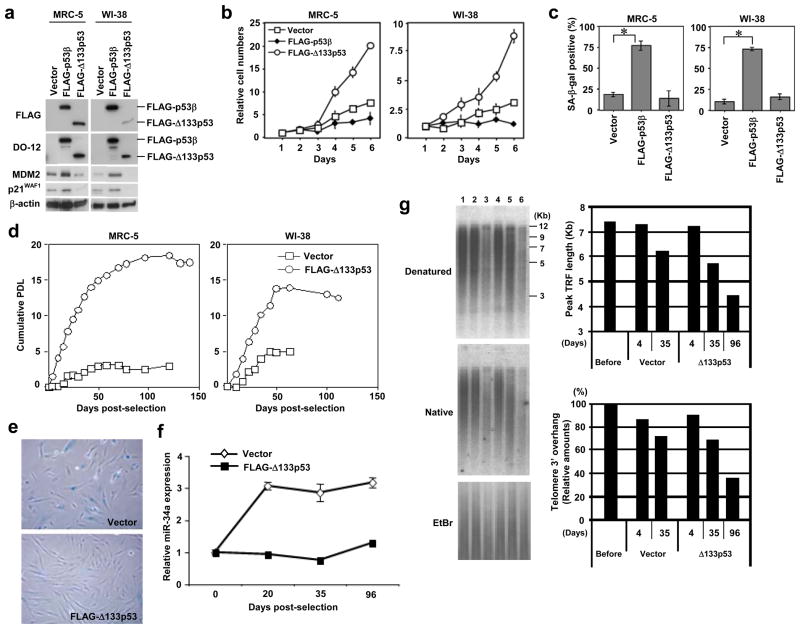
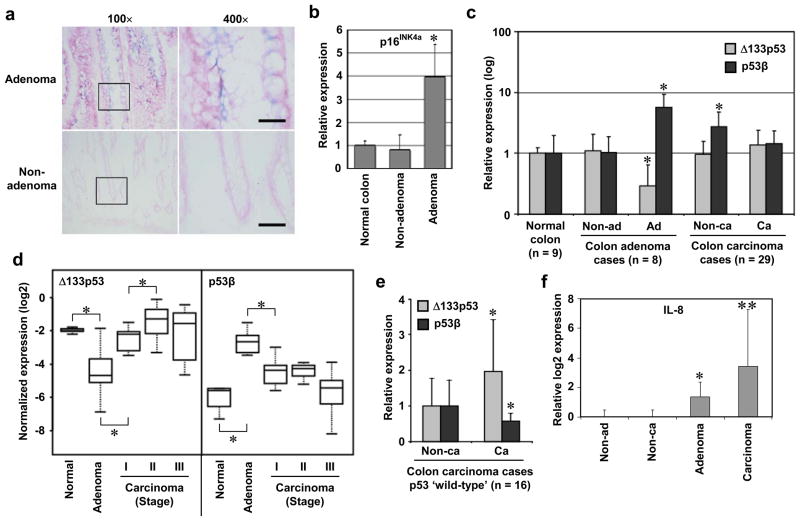
The finite proliferative potential of normal human cells leads to replicative cellular senescence, which is a critical barrier to tumour progression in vivo. We show that the human p53 isoforms Delta133p53 and p53beta function in an endogenous regulatory mechanism for p53-mediated replicative senescence. Induced p53beta and diminished Delta133p53 were associated with replicative senescence, but not oncogene-induced senescence, in normal human fibroblasts. The replicatively senescent fibroblasts also expressed increased levels of miR-34a, a p53-induced microRNA, the antisense inhibition of which delayed the onset of replicative senescence. The siRNA (short interfering RNA)-mediated knockdown of endogenous Delta133p53 induced cellular senescence, which was attributed to the regulation of p21(WAF1) and other p53 transcriptional target genes. In overexpression experiments, whereas p53beta cooperated with full-length p53 to accelerate cellular senescence, Delta133p53 repressed miR-34a expression and extended the cellular replicative lifespan, providing a functional connection of this microRNA to the p53 isoform-mediated regulation of senescence. The senescence-associated signature of p53 isoform expression (that is, elevated p53beta and reduced Delta133p53) was observed in vivo in colon adenomas with senescent phenotypes. The increased Delta133p53 and decreased p53beta isoform expression found in colon carcinoma may signal an escape from the senescence barrier during the progression from adenoma to carcinoma.


Figures

Figure 1
Figure 1
Replicative senescence-associated changes in expression of endogenous p53 isoforms. (a) MAP4 antibody specifically recognizes Δ133p53. H1299 cells (p53-null) exogenously expressing full-length p53, p53β or Δ133p53 were analyzed in immunoblot using MAP4 (left) and DO-1 (right) antibodies. MAP4 detects Δ133p53, but not full-length p53 or p53β. (b) Induction of p53β and repression of Δ133p53 at replicative senescence. The immunoblot analyses were performed in early-passage (Y) and senescent (S) human fibroblast strains MRC-5 and WI-38. The examined passage numbers were 30 (Y) and 65 (S) for MRC-5; and 30 (Y) and 58 (S) for WI-38. TLQ40, an antibody detecting p53β isoforms; DO-12, an antibody used to detect full-length p53; CM1, an antibody used to simultaneously detect full-length p53, p53β and Δ133p53. Δ40p53β was a predominant form detected by TLQ40 and was constitutively expressed in both early-passage and senescent cells. p53 phosphorylated at serine 15 (pS15-p53) and p21WAF1 were also examined. β-actin was a loading control. H1299 cells overexpressing p53β and CC1 cells were used as the positive controls for p53β andΔ133p53, respectively. As indicated on full blots available in Supplementary Information, Fig. S10a, the data of TLQ40, MAP4, DO-12 and CM1 are composite images, but all the bands shown for each antibody were from the same blot. (c-e) No induction of p53β and no repression of Δ133p53 at oncogene-induced senescence (overexpression of H-RasV12) (c) and premature senescence with acute telomere dysfunction induced by shRNA knockdown of POT1 (d) or overexpression of a dominant-negative TRF2 mutant (e). Early-passage MRC-5 and WI-38 (at passage 32) were used. H1299 cells overexpressing p53β was the positive control for p53β. Vec, vector control. β-actin was a loading control.
Figure 2
Figure 2
Endogenous miR-34a is a regulator of replicative senescence. (a) Upregulation of miR-34a at replicative senescence. The same set of MRC-5 and WI-38 fibroblasts as in Fig. 1b were examined for miR-34a expression by real-time qRT-PCR. The data were normalized with control RNU66 expression and shown as the relative values (mean ± s.d. from triplicate sample). The reproducible results were obtained in three independent experiments.*, p < 0.001.**, p < 0.01. (b-e) LNA antisense knockdown of miR-34a extends cellular replicative lifespan. Late-passage MRC-5 fibroblasts (at passage 57) were transfected with antisense LNA oligonucleotide against miR-34a (LNA-anti-miR-34a) or control oligonucleotide. (b) Downregulation of miR-34a was confirmed by the real-time qRT-PCR, as in a. Error bars represent s.d. from triplicate sample. (c) Immunoblot analysis of the known targets of miR-34a (SIRT1 and E2F19). β-actin was a loading control. (d) Abrogation of the miR-34a binding site-dependent repression by LNA-anti-miR-34a in luciferase reporter assay. A luciferase reporter construct, pMIR-MYCN-WT containing two miR-34a binding sites (+) or pMIR-MYCN-MT1&2 with these sites mutated (−), and pRL-SV40 (control plasmid for normalization) were co-transfected with LNA-anti-miR-34a (+) or control oligonucleotide (−). Normalized luciferase activities (mean ± s.d. from triplicate samples) are shown relative to the value obtained with pMIR-MYCN-MT1&2 (−) and control oligonucleotide (−).*, p < 0.05. (e) The transfection of LNA-anti-miR-34a or control oligonucleotide was repeated every 4 days and the cumulative population doublings (PDL) were examined. (f-h) Antisense knockdown of miR-34a by 2′-O-methyl oligonucleotides. (f) Late-passage MRC-5 fibroblasts (at passage 58) were transfected with antisense 2′-O-methyl oligonucleotide against miR-34a or control oligonucleotide (EGFP) and analyzed by real-time qRT-PCR assays of miR-34a (left) and miR-34b (right). A non-specific effect on miR-34b was not observed. (g) The oligonucleotide transfection was repeated every 4 days and the cumulative PDL were examined, as in e. (h) hTERT-immortalized human fibroblasts (hTERT/NHF) were transfected with the 2′-O-methyl oligonucleotides (miR-34a antisense or control) and induced to senesce by treatment with 10 μM of Nutlin-3a for 72 h. Summary of senescence-associated β-galactosidase (SA-β-gal) assay is shown. The data (mean ± s.d.) were from three independent experiments. *, p < 0.05.
Figure 3
Figure 3
Knockdown of endogenous Δ133p53 induces cellular senescence. Two independent siRNAs (Δ133si-1 and Δ133si-2) were designed to target the sequences that are present in Δ133p53 mRNA as 5′ untranslated region but spliced out of full-length p53 mRNA as intron 4. Early-passage WI-38 fibroblasts (at passage 30) were transfected with Δ133si-1, Δ133si-2 or a control oligonucleotide twice (at day 1 and day 4), and at day 7 were used for immunoblot analyses (a) and examined for SA-β-gal activity (b, c), bromo-deoxyuridine (BrdU) incorporation (d) and p53 target gene expression (e). (a) siRNA-mediated repression of Δ133p53. Expressions of full-length p53 (DO-1 antibody), Δ133p53 (MAP4 antibody), p53β (TLQ40 antibody) and p21WAF1 were examined. The expression levels of full-length p53 and Δ133p53 were also confirmed by the CM1 antibody. β-actin was a loading control. H1299 expressing p53β was the positive control for TLQ40. Full blots are available in Supplementary Information, Fig. S10b. (b) Representative pictures of SA-β-gal staining. (c) Summary of SA-β-gal assay. The data (mean ± s.d.) were from three independent experiments.*, p < 0.01. (d) BrdU incorporation assay. The number of BrdU-positive cells/the total number of cells examined (at least 100 cells for each well) was recorded. Data are mean ± s.d. from triplicate wells.*, p < 0.05.**, p < 0.01. (e) Real-time qRT-PCR analysis of p53 target genes. The expression levels in the Δ133p53 siRNA-transfected cells (si-1 and si-2) are shown as the relative values to those in control cells (Cont). Data are mean ± s.d. from triplicate samples.*, p < 0.05.**, p < 0.01.***, p < 0.001.
Figure 4
Figure 4
Overexpression of p53β induces senescence and overexpression of Δ133p53 extends replicative lifespan. (a-c) Early-passage MRC-5 and WI-38 fibroblasts (both at passage 32) were retrovirally transduced with vector alone, FLAG-tagged p53β or FLAG-tagged Δ133p53. (a) Immunoblot analyses of the overexpressed p53 isoforms, MDM2 and p21WAF1. Protein samples at 8 days after retroviral transduction were analyzed. The anti-FLAG and DO-12 antibodies detected FLAG-tagged p53β and FLAG-tagged Δ133p53. β-actin was a loading control. (b) Cell proliferation assay. The cells with vector alone (open squares), FLAG-tagged p53β (closed diamonds) and FLAG-tagged Δ133p53 (open circles) were used at 8 days after retroviral transduction. The data (mean ± s.d.) were from triplicate wells. (c) Summary of SA-β-gal assay. The same set of cells as in b were examined. The data (mean ± s.d.) were from three independent experiments. *, p < 0.01. (d-g) Extension of cellular replicative lifespan by Δ133p53. The FLAG- Δ133p53 retroviral vector or the control vector was transduced to human fibroblasts at late passage (MRC-5 at passage 53 and WI-38 at passage 51). (d) The cumulative PDL were calculated and plotted to days post-selection. Open squares, vector alone. Open circles, FLAG- Δ133p53. (e) SA-β-gal staining. The pictures at 36 days post-selection are shown. (f) Repression of miR-34a by Δ133p53. MRC-5 (at passage 53) before transduction (day 0), MRC-5 with control vector and MRC-5 overexpressing FLAG- Δ133p53 (at days 20, 35 and 96 post-selection) were examined for miR-34a expression by qRT-PCR, as in Fig. 2a. The value before transduction was defined as 1.0 and the expression levels in the other samples were expressed as the relative values (mean ± s.d. from triplicate sample). (g) Measurement of telomere length (denatured gel) and telomeric 3′ overhang (native gel) by in-gel hybridization. Lane 1, MRC-5 before transduction. Lanes 2 and 3, MRC-5 with vector control (days 4 and 35 post-selection). Lanes 4–6, MRC-5 overexpressing FLAG- Δ133p53 (days 4, 35 and 96 post-selection). The telomere lengths were measured as peak TRF (terminal restriction fragment) lengths. The amounts of telomeric 3′ overhang were normalized with loaded DNA amounts (EtBr) and shown as percent signals to the cells before transduction.
Figure 5
Figure 5
p53 isoform expression profiles in colon carcinogenesis in vivo. Elevated p53β and reduced Δ133p53 in colon adenomas with senescent phenotypes, but not in colon carcinomas. (a) SA-β-gal staining of non-adenoma and adenoma tissues. Case 7 is shown. The rectangular areas are enlarged in the right panels. Bars, 500 μm. (b) Nine normal colon tissues (Supplementary Table S1) and 8 matched pairs of non-adenoma and adenoma tissues (Supplementary Table S2) were examined for p16INK4a expression in immunoblot and quantitatively analyzed. The data (mean ± s.d.) are shown as the relative values to normal colon samples. *, p < 0.0001. (c) Expression levels of p53β and Δ133p53 were quantitatively examined in 9 normal colon tissues (Supplementary Table S1), 8 matched pairs of non-adenoma and adenoma tissues (Supplementary Table S2) and 29 matched pairs of non-carcinoma and carcinoma tissues (Supplementary Table S3). The data (mean and s.d.) are shown in a logarithmic scale as the relative values to normal colon samples. *, p < 0.05. (d) Expression levels of Δ133p53 and p53β in colon carcinomas were analyzed according to tumour stage: stage I (n = 8), stage II (n = 11) and stage III (n = 10). The data of normal colon and adenoma samples are same as those in c. The data normalized to β-actin levels were converted to log2 values and shown as box-and-whisker plots. *, p < 0.05. (e) Upregulation of Δ133p53 in colon carcinomas assumed to have ‘wild-type’ p53 (n = 16; Supplementary Table S3). The expression levels of Δ133p53 and p53β (mean and s.d.) in carcinoma tissues were expressed relative to those in non-carcinoma tissues. *, p < 0.05. The same data were analyzed by paired t-test in Supplementary Fig. S8. p53β was significantly less abundant in carcinoma tissues because of the marked increase in non-carcinoma tissues as shown in c. (f) IL-8 expression was examined by qRT-PCR in the same non-adenoma, adenoma, non-carcinoma and carcinoma tissues as above. The expression levels (mean and s.d.) are shown as relative log2 values to non-adenoma (defined as 0). *, p < 0.05. **, p < 0.001.

Similar articles

Cited by

References

    1. Bartkova J, et al. Oncogene-induced senescence is part of the tumorigenesis barrier imposed by DNA damage checkpoints. Nature. 2006;444:633–637. - PubMed
    1. Collado M, Blasco MA, Serrano M. Cellular senescence in cancer and aging. Cell. 2007;130:223–233. - PubMed
    1. Halazonetis TD, Gorgoulis VG, Bartek J. An oncogene-induced DNA damage model for cancer development. Science. 2008;319:1352–1355. - PubMed
    1. Bourdon JC, et al. p53 isoforms can regulate p53 transcriptional activity. Genes Dev. 2005;19:2122–2137. - PMC - PubMed
    1. Bommer GT, et al. p53-mediated activation of miRNA34 candidate tumor-suppressor genes. Curr Biol. 2007;17:1298–1307. - PubMed

Publication types

MeSH terms