. 2009 Sep;11(9):1069-80.
doi: 10.1038/ncb1920. Epub 2009 Aug 23.

Golgi-derived CLASP-dependent microtubules control Golgi organization and polarized trafficking in motile cells

Affiliations

Golgi-derived CLASP-dependent microtubules control Golgi organization and polarized trafficking in motile cells

Paul M Miller et al. Nat Cell Biol. 2009 Sep.

Abstract

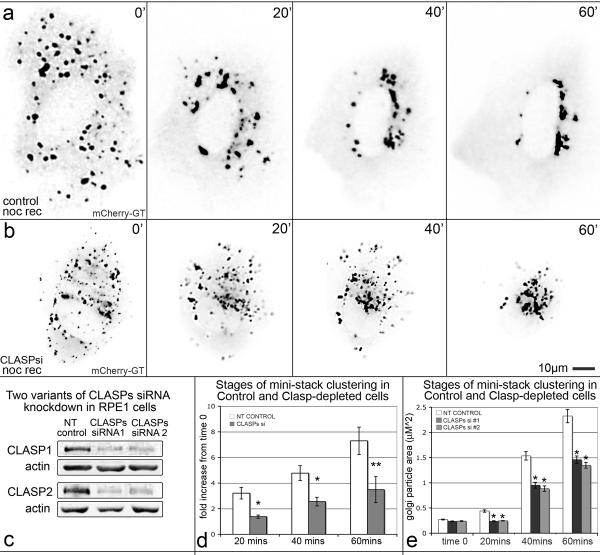
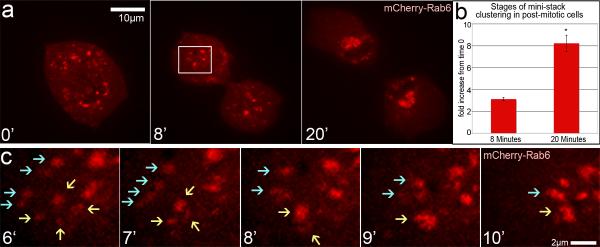
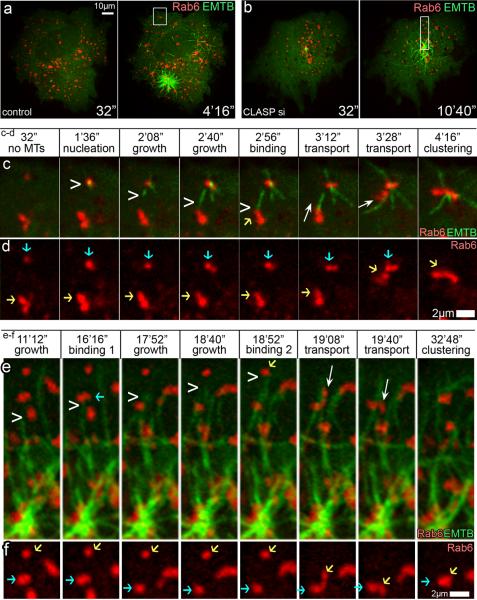
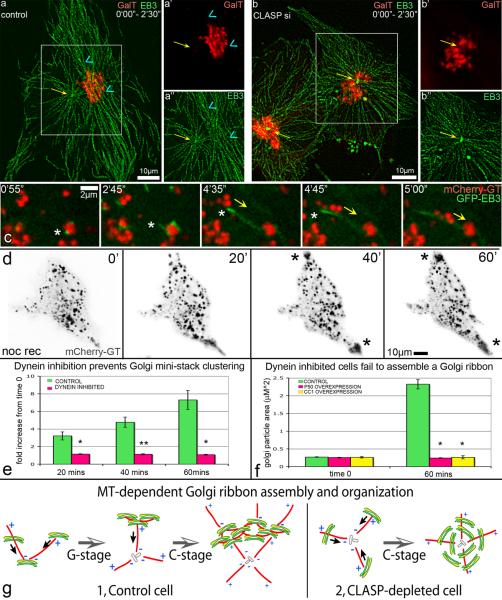
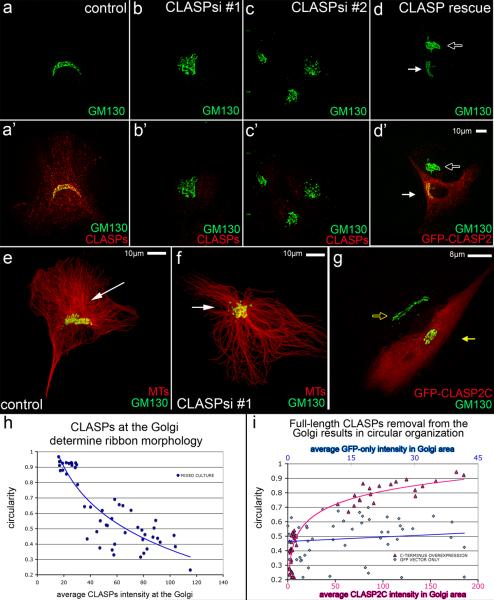
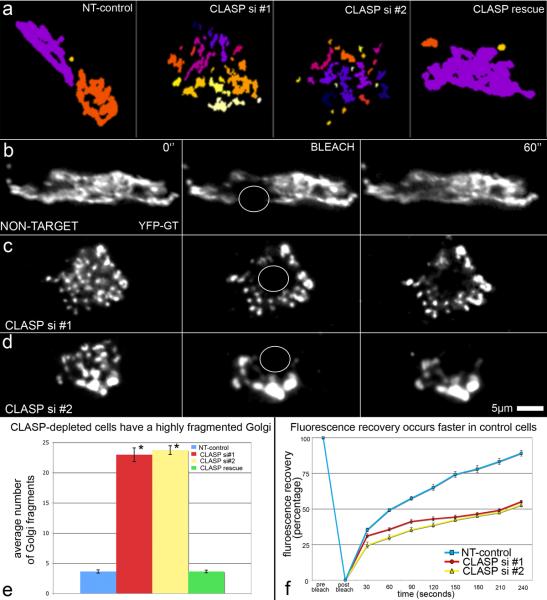
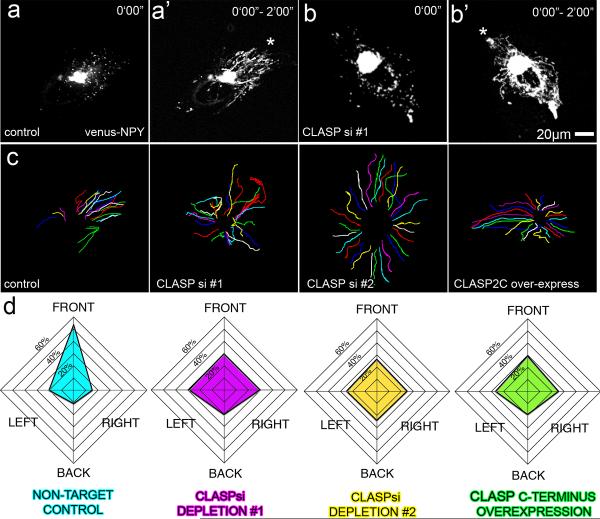
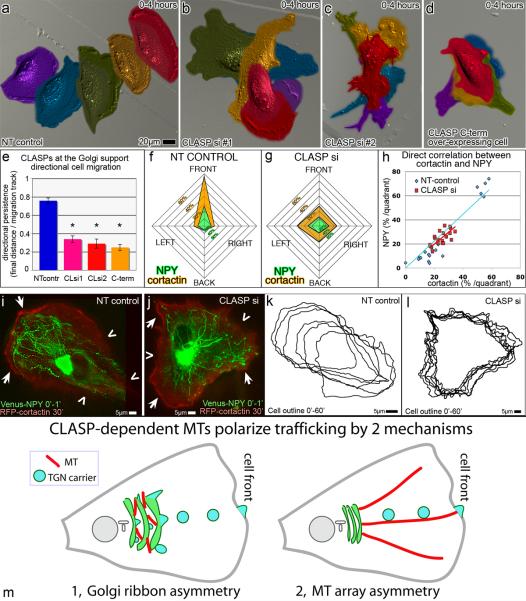
Microtubules are indispensable for Golgi complex assembly and maintenance, which are integral parts of cytoplasm organization during interphase in mammalian cells. Here, we show that two discrete microtubule subsets drive two distinct, yet simultaneous, stages of Golgi assembly. In addition to the radial centrosomal microtubule array, which positions the Golgi in the centre of the cell, we have identified a role for microtubules that form at the Golgi membranes in a manner dependent on the microtubule regulators CLASPs. These Golgi-derived microtubules draw Golgi ministacks together in tangential fashion and are crucial for establishing continuity and proper morphology of the Golgi complex. We propose that specialized functions of these two microtubule arrays arise from their specific geometries. Further, we demonstrate that directional post-Golgi trafficking and cell migration depend on Golgi-associated CLASPs, suggesting that correct organization of the Golgi complex by microtubules is essential for cell polarization and motility.


Figures

Figure 1
Figure 1. The two-stage process of Golgi assembly requires CLASPs
(a–b) Video frames illustrating assembly of the Golgi marked by mCherry-tagged Galactosyltransferase (GT) in NT-control (a) and CLASP-depleted (siRNA combination #1, b) RPE1 cells recovering after nocodazole washout (noc rec). Time after nocodazole removal is shown. (c) Western blotting showing reduction of CLASP1 levels by ~75 % using siRNA combination #1 and by ~77 % using siRNA combination #2 and CLASP2 levels by ~88 % using siRNA combination #1 and by ~74 % using siRNA combination #2. Actin, loading control. (d) Golgi particle size upon nocodazole washout analysis based on live cell imaging experiments in NT-control (n=7, 6 independent experiments) and CLASP-depleted (n=7, 7 independent experiments) cells (as in a, b). Average fold size increase of Golgi particles relative to time 0 (nocodazole removal) is shown. Error bars, standard error. *P<0.01, **P<0.05, unpaired Student's t-test. (e) Average Golgi particle area (μm2) upon nocodazole washout based on GM130 immunolabeled fixed samples for of NT-control, CLASP siRNA combination #1, and CLASP siRNA combination #2 cells (as in Fig. S1). n=50 for each condition, 3 independent experiments. Error bars, standard error. *P<0.001, unpaired Student's t-test.
Figure 2
Figure 2. Golgi assembly occurs in 2 stages upon mitotic exit
(a) Video frames illustrating post-mitotic Golgi assembly in mCherry-Rab6 expressing RPE1 cells. Time zero marks approximate onset of telophase. Boxed area is enlarged below. (b) Post-mitotic Golgi particle size based on live imaging experiments in NT-control (n=4, 4 independent experiments) cells. Average fold increase of Golgi particles relative to time zero is shown. Error bars, standard error. *P<0.001, unpaired Student's t-test. (c) Enlarged box from (a) showing Golgi mini-stack (red) clustering (6–9', blue and yellow arrows indicate two separate clusters) prior to re-location toward the centrosome (10').
Figure 3
Figure 3. Golgi mini-stacks clustering by Golgi-derived and centrosomal MTs
(a–b) Video frames illustrating MT formation in 3GFP-EMTB (green) and mCherry-Rab6 (red) expressing RPE1 cells upon nocodazole washout. Time after nocodazole removal is shown. (a) Control cell, MTs at Golgi mini-stacks and the centrosome. (b) CLASP-depleted cell (siRNA combination #1), MTs at the centrosome. Areas in boxes are enlarged below. (c) enlarged box from (a) showing MT nucleation (chevron) at Golgi mini-stacks (red), binding of mini-stacks to MT (yellow arrow), and transport along MT (white arrow) resulting in clustering along Golgi-nucleated MT. mCherry-Rab6 (red), GFP-EB3 (green). Note transport of a mini stack toward cell periphery and subsequent tangential linking. (d) Mini-stack clustering from (c), mCherry-Rab6 alone. Blue arrow, mini-stack where MT nucleates. Yellow arrow, transported mini-stack. (e) Enlarged box from (b) showing centrosomal MTs growing (chevron), binding to 2 mini-stacks subsequently (blue and yellow arrows), and transport (white arrow) of the second mini-stack resulting in radial clustering in peri-centrosomal area. mCherry-Rab6 (red), GFP-EB3 (green). (f) Mini-stack clustering from (e), mCherry-Rab6 alone. Blue arrow, mini-stack proximal to the centrosome. Yellow arrow, transported mini-stack.
Figure 4
Figure 4. Golgi assembly depends on directionality of two MT subsets and on dynein activity
(a–b) Overlaid GFP-EB3 (green) and mCherry-GT (red) video frames within 2.5 min. (a) EB3 tracks in a control cell illustrate radial centrosomal (yellow arrow) and tangential Golgi-associated (blue arrowhead) MT arrays. Box is enlarged in (a') for mCherry-GT and in (a”) for GFP-EB3. (b) Radial centrosomal (yellow arrow) EB3 tracks in CLASP-depleted cell (siRNA combination #1). Box is enlarged in (b') for mCherry-GT and in (b”) for GFP-EB3. (c) Video frames illustrating minus-end directed mini-stack movement (yellow arrow) along Golgi-nucleated MTs upon nocodazole washout in mCherry-GT (red) and GFP-EB3 (green) expressing NT control cells. MT plus end, asterisk. Time after nocodazole removal is shown. (d) Video frames illustrating nocodazole washout in cell over-expressing GFP-P50 (not shown) and mCherry-GT (black). Mini-stacks move toward the cell periphery along forming MTs due to kinesin activity (asterisks). Time after nocodazole removal is shown. (e) Fold increase of Golgi particle size upon nocodazole washout based on live cell imaging of control (n=7, 6 independent experiments) and GFP-P50 over-expressing (n=8, 7 independent experiments) cells. Error bars, standard error. *P<0.001, unpaired Student's t-test. (f) Average Golgi particle area (μm2) in nocodazole (time 0) and upon 60 min washout in fixed samples of control, GFP-P50 over-expressing, and RFP-CC1 over-expressing cells. n=50 for each condition, 4 independent experiments. Error bars, standard error. *P<0.001, **P<0.01 unpaired Student's t-test. (g) Role of Golgi-associated MTs in Golgi ribbon assembly (model).
Figure 5
Figure 5. CLASPs at the Golgi determine ribbon morphology
(a) Control cells have a ribbon-like Golgi (GM130, green) when CLASPs (red, a') are present. (b–c) Golgi (green) morphology is circular when CLASPs (red, b', c') are depleted from cells. (d) Ribbon-like Golgi morphology (white arrow) is restored in CLASP-depleted cells expressing a nonsilenceable GFP-CLASP2C construct (d', false-colored red). The Golgi (GM-130, false-colored green) remains circular in non-expressing cells (hollow arrow). (e–f) Immunostainings of Golgi (GM130, green) and MTs (red). (e) Control cell showing ribbon-like Golgi in the presence of Golgi-associated MTs (white arrow). (f) CLASP-depleted cell (siRNA combination #2) showing circular Golgi morphology and radial centrosomal MT array (white arrow). (g) Ribbon-like Golgi (GM130, false-colored green, hollow yellow arrow) turns circular (yellow arrow) in cells over-expressing GFP-CLASP2C (false-colored red). (h) Golgi circularity depends on CLASPs intensity at the Golgi. Average CLASP intensity at the Golgi in mixed-culture cell plotted against circularity index (n=50, 4 independent experiments). (i) Removal of full-length CLASP results in circular morphology. Average GFP-CLASP2C intensity (pink, lower x-axis) and GFP vector only intensity (blue, top x-axis) in the Golgi area plotted against circularity index (n=50, 3 independent experiments for each condition). Cells with similar overall expression levels are compared, in which GFP-CLASP2c intensity in the Golgi region is 4 to 5 times higher than GFP due to specific accumulation of GFP-CLASP2C in the Golgi area (~1/5 of the cell area). GFP-CLASP2C but not GFP expression leads to circular Golgi morphology.
Figure 6
Figure 6. Golgi fragmentation in CLASP-depleted cells results in diminished enzyme mobility within the Golgi complex
(a) Representative data from 3-dimensional objects counter analysis based of GM130 immunostaining. Colored segments represent interconnected Golgi fragments. (b–d) Video frames illustrating fluorescence recovery after photobleaching in YFP-GT expressing cells. Time points shown are pre-bleach (0”), bleach, and 60 seconds post-bleach. Bleached regions are indicated by white circles. (b) NT-control. (c) CLASP depletion siRNA combination #1. (d) CLASP depletion siRNA combination #2. (e) Numbers of Golgi fragments in NT-ctl (blue), CLASPs-depletion #1 (red), CLASPs-depletion #2 (yellow), and CLASP rescue (green) cells. n=30, 5 independent experiments for each condition. Error bars, standard error. *P<0.001, unpaired Student's t-test. (f) Graph showing fluorescence recovery rates for NT-control (blue), CLASP siRNA combination #1 (red), and CLASP siRNA combination #2 (yellow). n=20 for each condition. NT-control = 4 independent experiments, CLASP si #1 and CLASP si #2 = 5 independent experiments.
Figure 7
Figure 7. CLASP-dependent MTs polarize trafficking to the cell front
(a–b) Video frames showing post-Golgi trafficking in Venus-NPY expressing RPE1 cells. (a) NT-control. (b) CLASP-depleted cell. (a, b) Snapshot of NPY vesicles (a', b'). Overlaid Venus-NPY images within 2 minutes show directional trafficking toward the cell front (asterisks) in control cells (a') and symmetric trafficking (b') in CLASP-depleted cells. (c) Examples of particle tracking analysis. Particle movement tracks within 2 mins for NT-control, CLASP siRNA combination #1, CLASP siRNA combination #2, and GFP-CLASP2C over-expressing cells. (d) Graphs showing trafficking directionality in NT-control (blue), CLASP siRNA combination #1 (purple), CLASP siRNA combination #2 (yellow), and GFP-CLASP2C over-expressing (green) cells. Data represents average percentage of tracks corresponding to the cell front, right, rear, and left. n=30 for each condition, NT-control = 4 independent experiments, CLASP si #1 and CLASP si #2 = 6 independent experiments, CLASP C-term = 3 independent experiments.
Figure 8
Figure 8. CLASP-dependent MTs regulate directional cell migration
(a–d) False-colored DIC video frames showing single RPE1 cell migration over a time period of 4 hours. Purple indicates time 0, blue = 1hr, green = 2hrs, yellow =3hrs, and red =4hrs. (a) Control cells exhibit directionally persistent migration. CLASP-depleted cells (b–c) and CLASP2C (d) over-expressing cells show random migration patterns. (e) Average directional persistence for NT-control (n=13, blue), CLASP siRNA combination #1 (n=12, pink) and #2 (n=17, red), and CLASP2C over-expressing (n=15, orange) cells each from 4 independent experiments. Error bars, standard error. *P<0.001, unpaired Student's t-test. (f–g) NPY trafficking (green) directionality and cortactin cell edge distribution (orange) in migrating NT-control (f) and CLASP-depleted (g) cells. Data represent average percentage per quadrant (Fig. S6) of track number within 1 min and cortactin-associated cell edge length over 30 min thereafter. n=5 from 4 independent experiments for each condition. (h) Direct correlation between NPY track number and cortactin-rich cell edge in NT-control (blue) and CLASP-depleted (red) cells. Each point represents correlation within one quadrant of an individual cell. (i–j) NPY tracks within 1 minute (green) overlaid with RFP-cortactin (red (see “Image processing”)) at 30 minutes after track recording in NT-control (i) and CLASP-depleted (j) cells. Arrows, cortactin enrichment. Chevrons, regions lacking cortactin. (k–l) Cell outlines showing cell relocation and edge dynamics over 1 hour with 10 minute interval. (k) NT-control, same as (i). (l) CLASP-depleted cell, same as (j). (m) Proposed mechanisms by which CLASP-dependent MTs polarize trafficking (model).

Similar articles

Cited by

References

    1. Walczak CE, Heald R. Mechanisms of mitotic spindle assembly and function. Int Rev Cytol. 2008;265:111–58. - PubMed
    1. Karsenti E, et al. Interconversion of metaphase and interphase microtubule arrays, as studied by the injection of centrosomes and nuclei into Xenopus eggs. J Cell Biol. 1984;98(5):1730–45. - PMC - PubMed
    1. Zhai Y, et al. Microtubule dynamics at the G2/M transition: abrupt breakdown of cytoplasmic microtubules at nuclear envelope breakdown and implications for spindle morphogenesis. J Cell Biol. 1996;135(1):201–14. - PMC - PubMed
    1. Bulinski JC, Richards JE, Piperno G. Posttranslational modifications of alpha tubulin: detyrosination and acetylation differentiate populations of interphase microtubules in cultured cells. J Cell Biol. 1988;106(4):1213–20. - PMC - PubMed
    1. Gundersen GG, Gomes ER, Wen Y. Cortical control of microtubule stability and polarization. Curr Opin Cell Biol. 2004;16(1):106–12. - PubMed

Publication types