Evaluation of CYP3A activity in humans using three different parameters based on endogenous cortisol metabolism
- PMID: 19701237
- PMCID: PMC4007188
- DOI: 10.1038/aps.2009.116
Evaluation of CYP3A activity in humans using three different parameters based on endogenous cortisol metabolism
Abstract
Aim: Currently, there is considerable debate as to which method is more accurate for measuring the activity of CYP3A in vivo: cortisol 6beta-hydroxylation clearance (Cl(m(6beta))) or the urinary ratio of 6beta-OHF to F (6beta-OHF/F). Furthermore, the value of measuring endogenous levels of cortisol over a 24 h period (AUC(F)) needs to be confirmed. The aim of the present study was to determine which method was most effective at measuring changes in the in vivo activity of CYP3A: AUC(F), Cl(m(6beta)), or 6beta-OHF/F.
Methods: A two phase, cross-over design was adopted in this study. A total of 24 subjects (12 males and 12 females) were randomly assigned to one of two groups: the test group subjects were given 250 mg clarithromycin tablets twice a day for a period of 4 d, whereas the control group received a placebo twice daily for a similar period. On d 5 of the study, the last dose of either clarithromycin or placebo was supplemented with an oral dose of 7.5 mg midazolam (MDZ); blood and urine samples were then collected at various times. All samples collected at the same sampling times on d 4 were used to evaluate the effects of MDZ administration on cortisol levels and metabolism. The ratio of 1-hydroxymidazolam (1-OHMDZ) concentration to MDZ concentration at 1 h (MR) was taken as a measure of the in vivo CYP3A activity. AUC(F), Cl(m(6beta)), and 6beta-OHF/F were also used as biomarkers for CYP3A activity.
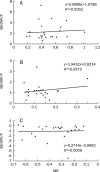
Results: No correlations were found (either before or after inhibition) between CYP3A activity and any of the following measures: AUC(F), Cl(m(6beta)), or 6beta-OHF/F (r<0.4, P>0.05). After 4 d of clarithromycin administration, CYP3A activity (MR) decreased by 75% (P=0.000), whereas AUC(F) increased by 19% (P=0.040), and Cl(m(6beta)) and 6beta-OHF/F decreased by 54.2% (P=0.000) and 50% (P=0.003), respectively. No significant changes in AUC(F) (P=0.178), or in the amount of urinary 6beta-OHF (P=0.169), or in F (P=0.391) were found over a 24 h time period, either with or without MDZ administration.
Conclusion: Although Cl(m(6beta)) and 6beta-OHF/F can reflect the decline in CYP3A activity, the impression they provide is neither accurate nor complete. AUC(F) is completely ineffective for evaluating variations in CYP3A activity. MDZ administration had no evident effects on either cortisol metabolism or excretion over a period of 24 h.
Figures


Similar articles
-
Associations of the CYP3A5*3 and CYP3A4*1G polymorphisms with the pharmacokinetics of oral midazolam and the urinary 6β-hydroxycortisol/cortisol ratio as markers of CYP3A activity in healthy male Chinese.J Clin Pharm Ther. 2016 Oct;41(5):552-8. doi: 10.1111/jcpt.12433. Epub 2016 Aug 11. J Clin Pharm Ther. 2016. PMID: 27511886
-
Endogenous cortisol 6 beta-hydroxylation clearance is not an accurate probe for overall cytochrome P450 3A phenotyping in humans.Clin Chim Acta. 2009 Oct;408(1-2):92-7. doi: 10.1016/j.cca.2009.07.017. Epub 2009 Aug 3. Clin Chim Acta. 2009. PMID: 19654004
-
Plasma 6β-hydroxycortisol to cortisol ratio as a less invasive cytochrome P450 3A phenotyping method.Br J Clin Pharmacol. 2024 Apr;90(4):1016-1026. doi: 10.1111/bcp.15987. Epub 2024 Jan 7. Br J Clin Pharmacol. 2024. PMID: 38102865
-
Evidence for the validity of cortisol 6 beta-hydroxylation clearance as a new index for in vivo cytochrome P450 3A phenotyping in humans.Drug Metab Dispos. 2003 Nov;31(11):1283-7. doi: 10.1124/dmd.31.11.1283. Drug Metab Dispos. 2003. PMID: 14570755
-
Urinary 6beta-hydroxycortisol: a validated test for evaluating drug induction or drug inhibition mediated through CYP3A in humans and in animals.Eur J Clin Pharmacol. 2003 Dec;59(10):713-33. doi: 10.1007/s00228-003-0690-3. Epub 2003 Nov 6. Eur J Clin Pharmacol. 2003. PMID: 14605790 Review.
Cited by
-
Interindividual Variability in Cytochrome P450-Mediated Drug Metabolism.Drug Metab Dispos. 2016 Mar;44(3):343-51. doi: 10.1124/dmd.115.067900. Epub 2015 Dec 17. Drug Metab Dispos. 2016. PMID: 26681736 Free PMC article. Review.
-
Phenotyping of Human CYP450 Enzymes by Endobiotics: Current Knowledge and Methodological Approaches.Clin Pharmacokinet. 2019 Nov;58(11):1373-1391. doi: 10.1007/s40262-019-00783-z. Clin Pharmacokinet. 2019. PMID: 31131437 Review.
-
The 1β-Hydroxy-Deoxycholic Acid to Deoxycholic Acid Urinary Metabolic Ratio: Toward a Phenotyping of CYP3A Using an Endogenous Marker?J Pers Med. 2021 Feb 20;11(2):150. doi: 10.3390/jpm11020150. J Pers Med. 2021. PMID: 33672438 Free PMC article.
-
Prediction of tacrolimus metabolism and dosage requirements based on CYP3A4 phenotype and CYP3A5(*)3 genotype in Chinese renal transplant recipients.Acta Pharmacol Sin. 2016 Apr;37(4):555-60. doi: 10.1038/aps.2015.163. Epub 2016 Feb 29. Acta Pharmacol Sin. 2016. PMID: 26924289 Free PMC article.
-
The influence of CYP3A5 polymorphisms on haloperidol treatment in patients with alcohol addiction.Pharmgenomics Pers Med. 2017 Dec 28;11:1-5. doi: 10.2147/PGPM.S144503. eCollection 2018. Pharmgenomics Pers Med. 2017. PMID: 29343979 Free PMC article.
References
-
- Williams JA, Ring BJ, Cantrell VE, Jones DR, Eckstein J, Ruterbories K, et al. Comparative metabolic capabilities of CYP3A4, CYP3A5, and CYP3A7. Drug Metab Dispos. 2002;30:883–91. - PubMed
-
- Krishna DR, Shekar MS. Cytochrome P450 3A: genetic polymorphisms and inter-ethnic differences. Methods Find Exp Clin Pharmacol. 2005;27:559–67. - PubMed
-
- Dahl ML. Cytochrome P450 phenotyping/genotyping in patients receiving antipsychotics: useful aid to prescribing. Clin Pharmacokinet. 2002;41:453–70. - PubMed
-
- Zaigler M, Tantcheva-Poor I, Fuhr U. Problems and perspectives of phenotyping for drug-metabolizing enzymes in man. Int J Clin Pharmacol Ther. 2000;38:1–9. - PubMed
-
- Streetman DS, Bertino JS, Nafziger AN. Phenotyping of drug-metabolizing enzymes in adults: a review of in vivo cytochrome P450 phenotyping probes. Pharmacogenetics. 2000;10:187–216. - PubMed
Publication types
MeSH terms
Substances
LinkOut - more resources
Full Text Sources

