. 2009 Aug 24;4(8):e6671.
doi: 10.1371/journal.pone.0006671.

Host, weather and virological factors drive norovirus epidemiology: time-series analysis of laboratory surveillance data in England and Wales

Affiliations

Host, weather and virological factors drive norovirus epidemiology: time-series analysis of laboratory surveillance data in England and Wales

Ben Lopman et al. PLoS One. .

Abstract

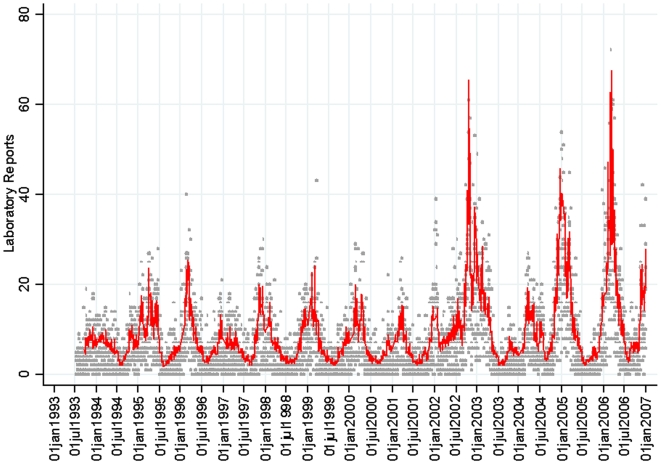
Norovirus, the most commonly identified cause of both sporadic cases and outbreaks of infectious diarrhoea in developed countries, exhibits a complex epidemiology and has a strong wintertime seasonality. Viral populations are dynamic and evolve under positive selection pressure.

Methods: Time series-adapted Poisson regression models were fitted to daily counts of laboratory reports of norovirus in England and Wales from 1993 to 2006.

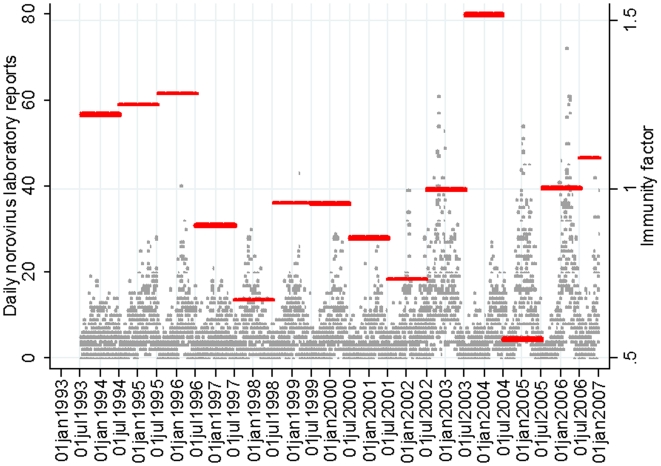
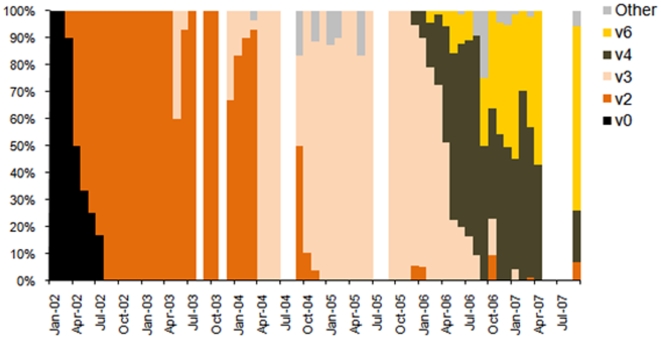
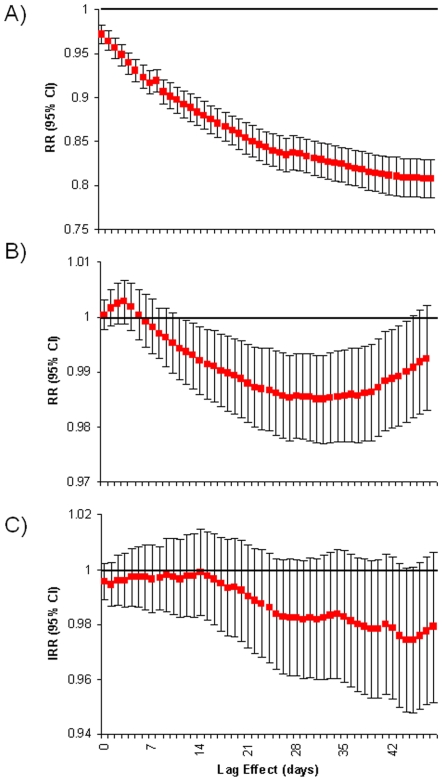
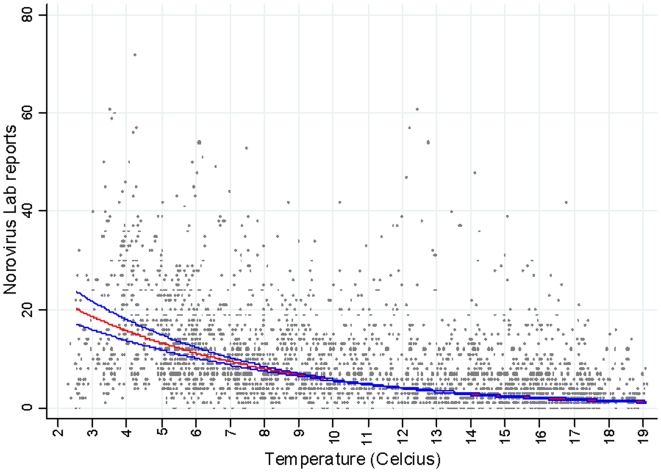
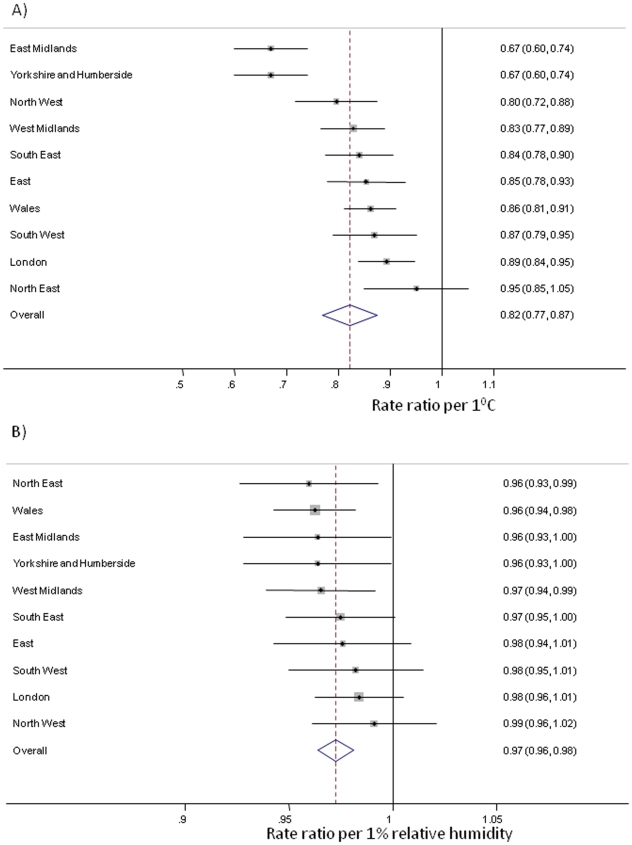
Findings: Inverse linear associations with daily temperature over the previous seven weeks (rate ratio (RR) = 0.85; 95% CI: 0.83 to 0.86 for every 1 degrees C increase) and relative humidity over the previous five weeks (RR = 0.980; 95% CI: 0.973 to 0.987 for every 1% increase) were found, with temperature having a greater overall effect. The emergence of new norovirus variants (RR = 1.16; 95% CI: 1.10 to 1.22) and low population immunity were also associated with heightened norovirus activity. Temperature and humidity, which may be localised, had highly consistent effects in each region of England and Wales.

Conclusions: These results point to a complex interplay between host, viral and climatic factors driving norovirus epidemic patterns. Increases in norovirus are associated with cold, dry temperature, low population immunity and the emergence of novel genogroup 2 type 4 antigenic variants.


Conflict of interest statement

Competing Interests: The authors have declared that no competing interests exist.

Figures

Figure 1
Figure 1. Annual calculated norovirus immunity factor.
Grey dots are number of daily laboratory reports to the Health Protection Agency from 1993 to 2007. Red bars are the calculated ‘immunity factor’ which represents the level of population immunity calculated based on the size of last year's season. An immunity factor of 1 indicates a typical season in the previous year; greater than 1 indicated that last year was a larger than normal season.
Figure 2
Figure 2. Changes in the genetic populations of norovirus genogroup 2 genotype 4 variants based on sequencing of the capsid region, 2002–2007.
Based on sequencing results from the Health Protection Agency Enteric Virus Unit structured strain surveillance (n = 1378 viruses sequenced from 2002 to 2007). Strains were assigned to a variant group according to conserved nucleotides at positions 18 (A or G), 26 (G, A or C) and 43 (A or G) of the gene encoding the capsid. Variants were numbered chronologically. Variants circulating at<10% are not shown. Note: v1 was not detected in UK based samples, so is excluded from this figure.
Figure 3
Figure 3. Association of lagged effects of (A) temperature (B) relative humidity and (C) precipitation.
Point estimates of rate ratios (red points) and 95% confidence intervals (black lines) are plotted for each day of lag between climate variable and norovirus reports. Presented results are from preliminary models controlling for confounders, secular trends and background seasonality.
Figure 4
Figure 4. Daily norovirus laboratory reports (grey circles) and predicted values (red line) from full model including temperature, relative humidity, immunity, new variants and autoregressive terms and other confounders.
Figure 5
Figure 5. Predicted relationship between temperature and norovirus reports.
Predicted relationship (red line) and 95% confidence bounds (blue lines) from full final model including relative humidity, immunity, new variants and autoregressive terms and other confounders.
Figure 6
Figure 6. Forest plot of regional and pooled estimates of the relationship between (A) temperature and (B) relative humidity with norovirus reports.
Regional RR estimates (box and horizontal line) and national pooled estimate (diamond) from random effects model are for 1°C and 1% relative humidity controlling for all other weather, confounding variables in the final regression model.

References

    1. de Wit MA, Koopmans MP, Kortbeek LM, Wannet WJ, Vinje J, et al. Sensor, a population-based cohort study on gastroenteritis in the Netherlands: incidence and etiology. Am J Epidemiol. 2001;154:666–674. - PubMed
    1. Wheeler JG, Sethi D, Cowden JM, Wall PG, Rodrigues LC, et al. Study of infectious intestinal disease in England: rates in the community, presenting to general practice, and reported to national surveillance. The Infectious Intestinal Disease Study Executive. BMJ. 1999;318:1046–1050. - PMC - PubMed
    1. Lopman BA, Reacher MH, Vipond IB, Hill D, Perry C, et al. Epidemiology and cost of nosocomial gastroenteritis, Avon, England, 2002-2003. Emerg Infect Dis. 2004;10:1827–1834. - PMC - PubMed
    1. Hedlund KO, Rubilar-Abreu E, Svensson L. Epidemiology of calicivirus infections in Sweden, 1994–1998. J Infect Dis. 2000;181(Suppl 2):S275–S280. - PubMed
    1. Harris JP, Edmunds WJ, Brown DW, Pebody R, Lopman B. Deaths from norovirus among the elderly, England and Wales. Emerg Infect Dis 2008 - PMC - PubMed