

Cancer abolishes the tissue type-specific differences in the phenotype of energetic metabolism
- PMID: 19701498
- PMCID: PMC2730139
- DOI: 10.1593/tlo.09106
Cancer abolishes the tissue type-specific differences in the phenotype of energetic metabolism
Abstract
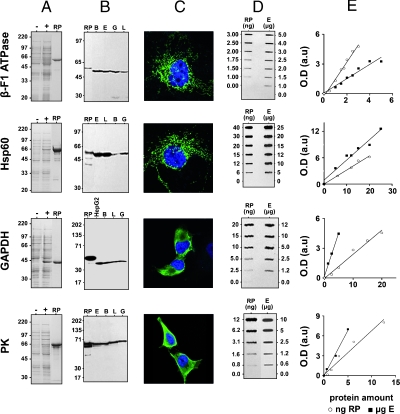
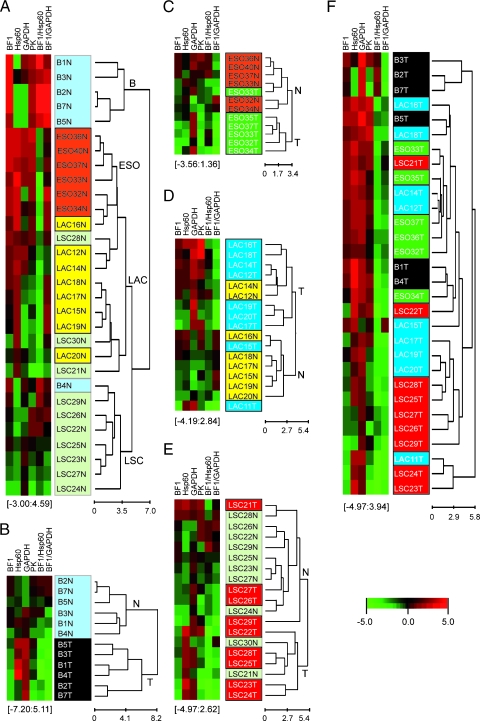
Nowadays, cellular bioenergetics has become a central issue of investigation in cancer biology. Recently, the metabolic activity of the cancer cell has been shown to correlate with a proteomic index that informs of the relative mitochondrial activity of the cell. Within this new field of investigation, we report herein the production and characterization of high-affinity monoclonal antibodies against proteins of the "bioenergetic signature" of the cell. The use of recombinant proteins and antibodies against the mitochondrial beta-F1-ATPase and Hsp60 proteins and the enzymes of the glycolytic pathway glyceraldehyde-3-phosphate dehydrogenase and pyruvate kinase M2 in quantitative assays provide, for the first time, the actual amount of these proteins in normal and tumor surgical specimens of breast, lung, and esophagus. The application of this methodology affords a straightforward proteomic signature that quantifies the variable energetic demand of human tissues. Furthermore, the results show an unanticipated finding: tumors from different tissues and/or histological types have the same proteomic signature of energetic metabolism. Therefore, the results indicate that cancer abolishes the tissue-specific differences in the bioenergetic phenotype of mitochondria. Overall, the results support that energetic metabolism represents an additional hallmark of the phenotype of the cancer cell and a promising target for the treatment of diverse neoplasias.
Figures
Similar articles
-
Breast carcinomas fulfill the Warburg hypothesis and provide metabolic markers of cancer prognosis.Carcinogenesis. 2005 Dec;26(12):2095-104. doi: 10.1093/carcin/bgi188. Epub 2005 Jul 20. Carcinogenesis. 2005. PMID: 16033770
-
The mitochondrial bioenergetic capacity of carcinomas.IUBMB Life. 2010 Jul;62(7):554-60. doi: 10.1002/iub.352. IUBMB Life. 2010. PMID: 20552634 Review.
-
The bioenergetic signature of lung adenocarcinomas is a molecular marker of cancer diagnosis and prognosis.Carcinogenesis. 2004 Jul;25(7):1157-63. doi: 10.1093/carcin/bgh113. Epub 2004 Feb 12. Carcinogenesis. 2004. PMID: 14963017
-
The bioenergetic signature of isogenic colon cancer cells predicts the cell death response to treatment with 3-bromopyruvate, iodoacetate or 5-fluorouracil.J Transl Med. 2011 Feb 8;9:19. doi: 10.1186/1479-5876-9-19. J Transl Med. 2011. PMID: 21303518 Free PMC article.
-
Glucose avidity of carcinomas.Cancer Lett. 2009 Apr 18;276(2):125-35. doi: 10.1016/j.canlet.2008.08.007. Epub 2008 Sep 14. Cancer Lett. 2009. PMID: 18790562 Review.
Cited by
-
Expression, regulation and clinical relevance of the ATPase inhibitory factor 1 in human cancers.Oncogenesis. 2013 Apr 22;2(4):e46. doi: 10.1038/oncsis.2013.9. Oncogenesis. 2013. PMID: 23608753 Free PMC article.
-
Mitochondria-mediated energy adaption in cancer: the H(+)-ATP synthase-geared switch of metabolism in human tumors.Antioxid Redox Signal. 2013 Jul 20;19(3):285-98. doi: 10.1089/ars.2012.4883. Epub 2012 Sep 24. Antioxid Redox Signal. 2013. PMID: 22901241 Free PMC article. Review.
-
Overexpression of the ATPase Inhibitory Factor 1 Favors a Non-metastatic Phenotype in Breast Cancer.Front Oncol. 2017 Apr 10;7:69. doi: 10.3389/fonc.2017.00069. eCollection 2017. Front Oncol. 2017. PMID: 28443245 Free PMC article.
-
Impaired mitochondrial metabolism and mammary carcinogenesis.J Mammary Gland Biol Neoplasia. 2013 Mar;18(1):75-87. doi: 10.1007/s10911-012-9271-3. Epub 2012 Dec 27. J Mammary Gland Biol Neoplasia. 2013. PMID: 23269521 Free PMC article. Review.
-
Plasma metabolome and skin proteins in Charcot-Marie-Tooth 1A patients.PLoS One. 2017 Jun 2;12(6):e0178376. doi: 10.1371/journal.pone.0178376. eCollection 2017. PLoS One. 2017. PMID: 28575008 Free PMC article.
References
-
- Hanahan D, Weinberg RA. The hallmarks of cancer. Cell. 2000;100:57–70. - PubMed
-
- DeBerardinis RJ, Lum JJ, Hatzivassiliou G, Thompson CB. The biology of cancer: metabolic reprogramming fuels cell growth and proliferation. Cell Metab. 2008;7:11–20. - PubMed
-
- Kim JW, Dang CV. Cancer's molecular sweet tooth and the Warburg effect. Cancer Res. 2006;66:8927–8930. - PubMed
-
- Semenza GL, Artemov D, Bedi A, Bhujwalla Z, Chiles K, Feldser D, Laughner E, Ravi R, Simons J, Taghavi P, et al. “The metabolism of tumours”: 70 years later. Novartis Found Symp. 2001;240:251–260. - PubMed
-
- Gogvadze V, Orrenius S, Zhivotovsky B. Mitochondria in cancer cells: what is so special about them? Trends Cell Biol. 2008;18:165–173. - PubMed
LinkOut - more resources
Full Text Sources
Research Materials
Miscellaneous