. 2009;77 Suppl 9(0 9):89-99.
doi: 10.1002/prot.22540.

Structure prediction for CASP8 with all-atom refinement using Rosetta

Affiliations

Structure prediction for CASP8 with all-atom refinement using Rosetta

Srivatsan Raman et al. Proteins. 2009.

Abstract

We describe predictions made using the Rosetta structure prediction methodology for the Eighth Critical Assessment of Techniques for Protein Structure Prediction. Aggressive sampling and all-atom refinement were carried out for nearly all targets. A combination of alignment methodologies was used to generate starting models from a range of templates, and the models were then subjected to Rosetta all atom refinement. For the 64 domains with readily identified templates, the best submitted model was better than the best alignment to the best template in the Protein Data Bank for 24 cases, and improved over the best starting model for 43 cases. For 13 targets where only very distant sequence relationships to proteins of known structure were detected, models were generated using the Rosetta de novo structure prediction methodology followed by all-atom refinement; in several cases the submitted models were better than those based on the available templates. Of the 12 refinement challenges, the best submitted model improved on the starting model in seven cases. These improvements over the starting template-based models and refinement tests demonstrate the power of Rosetta structure refinement in improving model accuracy.


Figures

Figure 1
Figure 1. Methodological improvements
(A) Energy-based template selection for T0464 models derived from different templates and alignments. Each color represents an ensemble of all-atom refined models generated from a particular template. (B) Distribution of GDT-TS of models generated for T0460 from the standard length fragment set (green) vs. variable fragment length set (blue).
Figure 2
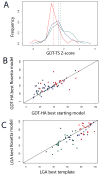
Figure 2. Model quality
(A) Distribution of GDT-TS Z-scores of the best Rosetta model for high and medium sequence similarity template(red) low sequence similarity template(blue) fold recognition/free modeling targets(green). The dashed lines represent the mean of the distribution: 0.68 for high and medium sequence similarity template, 1.28 for low sequence similarity template and 1.5 for fold recognition/free modeling targets. (B) Comparison of the GDT-HAs over the structurally alignable regions of the best starting model used vs. best-submitted Rosetta model. (C) Comparison of the sequence-dependent LGA of the best template (identified by the assessors) vs. best-submitted Rosetta model.
Figure 3
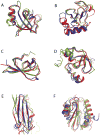
Figure 3. Examples of successful template-based predictions
For each target, the native structure is shown in blue, our best-submitted model in red and best template in green. (A) T0492 (B) T0464 (C) T0429 domain 1 (D) T0487 domain 4 (E) T0407 domain 2 (F) T0457 domain 2
Figure 4
Figure 4. Examples of predictions with atomic-level accuracy
The core sidechains of our of best-submitted model (red) and native (blue) are highlighted. (A) T0492 domain 1 (B) T0513 domain 2 (predicted by the BAKER-ROBETTA server)
Figure 5
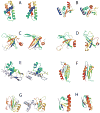
Figure 5. Examples of successful predictions in the fold-recognition/free-modeling category
In each panel, the native structure is on the left and our best-submitted model on the right. (A) T0405 (B) T0460 (C) T0467 (D) T0468 (E) T0476 (F) T0482 (G) T0496 domain 1 (H) T0513 (prediction made by BAKER-ROBETTA server)
Figure 6
Figure 6. Examples of successful predictions in the refinement category
For each target, the native structure is shown in blue, our best-submitted model in red and starting model in green (A) TR432 residues 32–47 (B) TR488 residues 11–18 (C) TR464 residues 19–27 (D) TR464 residues 39–44

Similar articles

Cited by

References

    1. Qian B, Raman S, Das R, Bradley P, McCoy AJ, Read RJ, Baker D. High-resolution structure prediction and the crystallographic phase problem. Nature. 2007;450(7167):259–264. - PMC - PubMed
    1. Rohl CA, Strauss CE, Misura KM, Baker D. Protein structure prediction using Rosetta. Methods Enzymol. 2004;383:66–93. - PubMed
    1. Bradley P, Misura KM, Baker D. Toward high-resolution de novo structure prediction for small proteins. Science. 2005;309(5742):1868–1871. - PubMed
    1. Baker D, Sohl JL, Agard DA. A protein-folding reaction under kinetic control. Nature. 1992;356(6366):263–265. - PubMed
    1. Anfinsen CB, Haber E, Sela M, White FH., Jr The kinetics of formation of native ribonuclease during oxidation of the reduced polypeptide chain. Proc Natl Acad Sci U S A. 1961;47:1309–1314. - PMC - PubMed

Publication types

LinkOut - more resources