. 2009 Aug 21;138(4):774-86.
doi: 10.1016/j.cell.2009.07.038.

Protein sectors: evolutionary units of three-dimensional structure

Affiliations

Protein sectors: evolutionary units of three-dimensional structure

Najeeb Halabi et al. Cell. .

Abstract

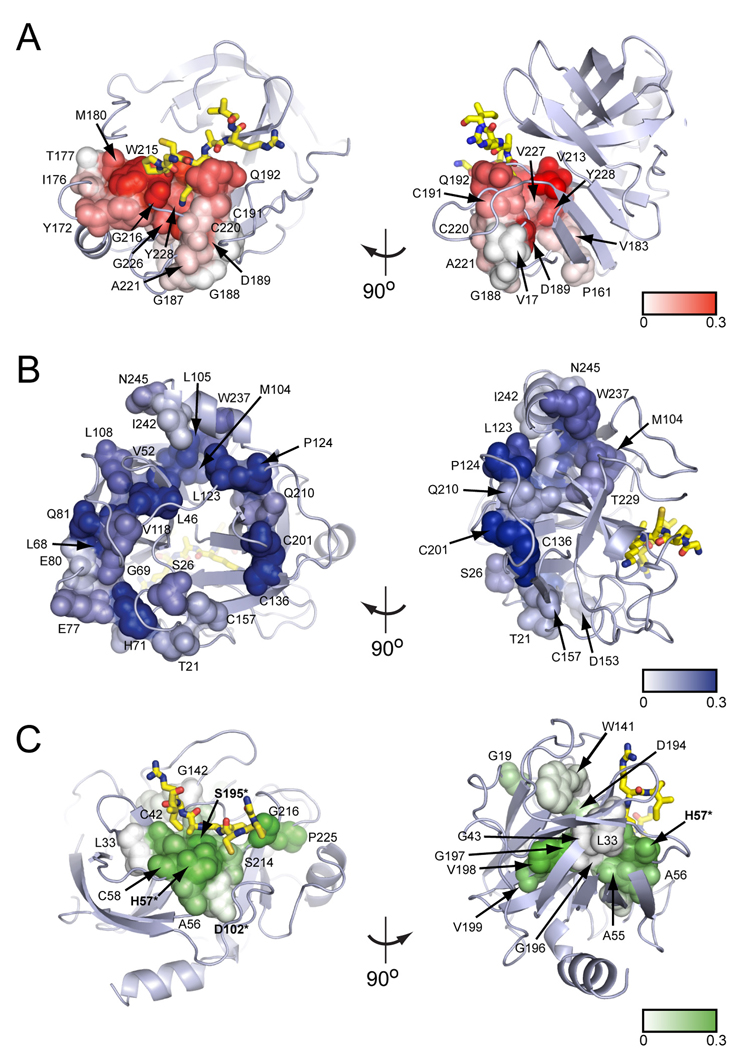
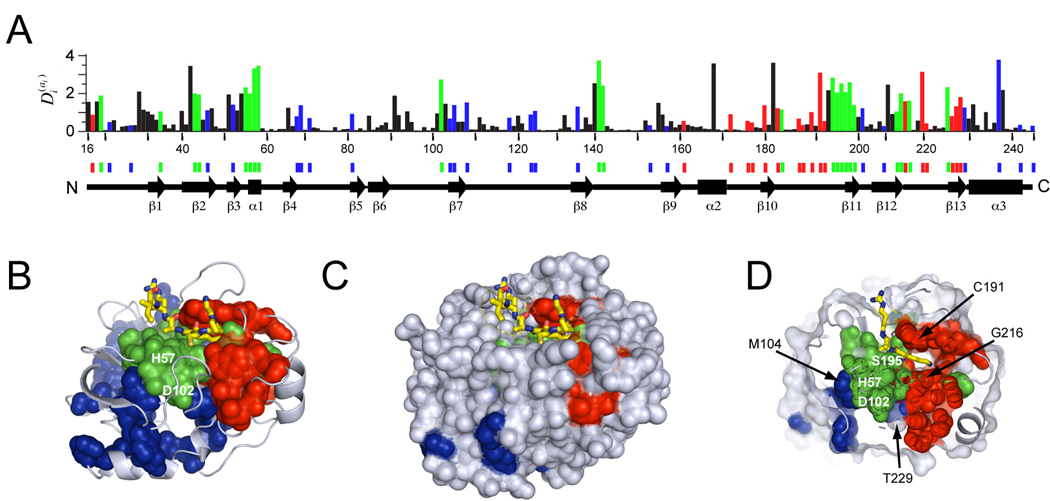
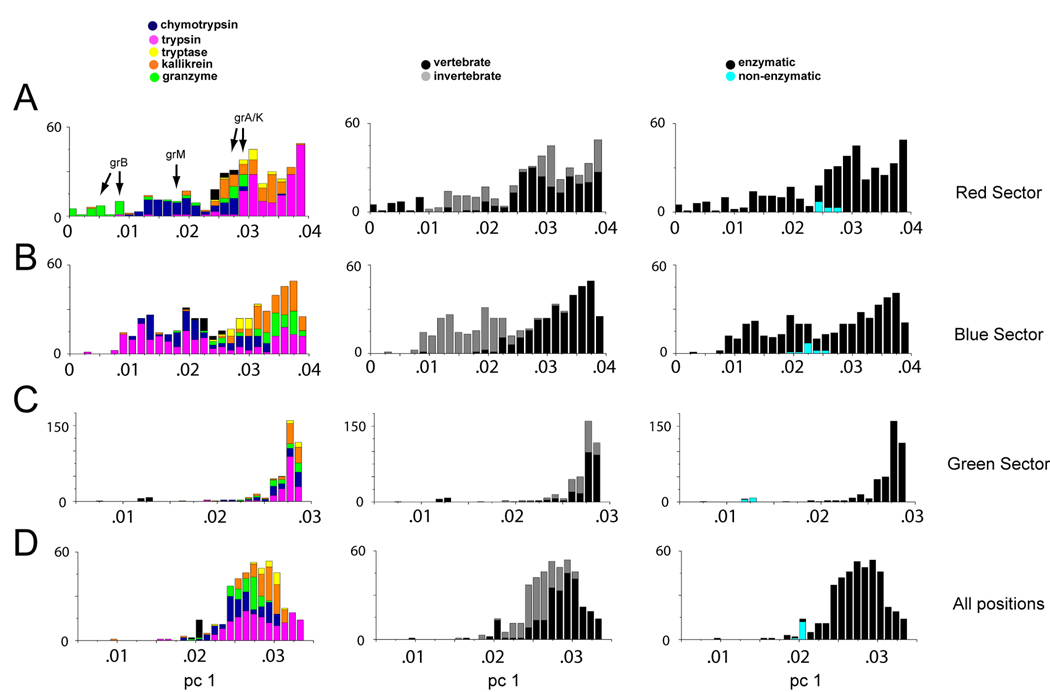
Proteins display a hierarchy of structural features at primary, secondary, tertiary, and higher-order levels, an organization that guides our current understanding of their biological properties and evolutionary origins. Here, we reveal a structural organization distinct from this traditional hierarchy by statistical analysis of correlated evolution between amino acids. Applied to the S1A serine proteases, the analysis indicates a decomposition of the protein into three quasi-independent groups of correlated amino acids that we term "protein sectors." Each sector is physically connected in the tertiary structure, has a distinct functional role, and constitutes an independent mode of sequence divergence in the protein family. Functionally relevant sectors are evident in other protein families as well, suggesting that they may be general features of proteins. We propose that sectors represent a structural organization of proteins that reflects their evolutionary histories.


Figures

Figure 1
Figure 1
Position-specific and correlated conservation in the S1A protease family. A, The conservation of each position i in a multiple sequence alignment of 1470 members of the S1A family, computed by the relative entropy Di(ai) (position numbering according to bovine chymotrypsin, and graph is aligned with the matrix below). B–C, Mapping of the moderate to strongly conserved positions in a surface view (B) and a slice through the core (C) of rat trypsin shows a simple and intuitive arrangement. Residues with Di(ai)>0.5 (in orange) occupy the protein core and regions contacting substrate, while less conserved positions are mostly located on the surface. The cutoff is chosen to color ~ 50% of residues to illustrate the pattern of conservation in the protein structure. D, SCA matrix ij for a sequence alignment of 1470 members of the protease family, showing a pattern of correlated conservation that is distributed throughout the primary structure and across secondary structure elements. E, SCA matrix after reduction of statistical noise and of global coherent correlations (see Supplementary Methods and Note). The 65 positions that remain fall into three groups of positions (red, blue, and green, termed “sectors”), each displaying strong intra-group correlations and weak inter-group correlations. In each sector, positions are ordered by descending magnitude of contribution (Fig. S3), showing that sector positions comprise a hierarchy of correlation strengths.
Figure 2
Figure 2
Statistical independence of the three sectors. A–D, For each pairwise combination of sectors (A, red-blue (RB), B, green-blue (GB), and C, green-red (GR)) and the combination of all three sectors (D, red-blue-green (RBG)), the graph shows the total correlation entropy (black bar), summed sector correlation entropies (stacked colored bars), and the average summed correlation entropy for 100 random groupings of the top five constituent residues (error bars represent standard deviation). In each case, the summed entropies of the sectors are close to the total entropies and are far from that expected randomly. Thus, the sectors are near-independent features of the protease family.
Figure 3
Figure 3
Structural connectivity of the three sectors. A–C, Residues comprising each sector displayed in space filling representation with a van der Waals surface on the tertiary structure of rat trypsin (PDB 3TGI(Pasternak et al., 1999)). Each sector comprises a spatially contiguous group of amino acids in the tertiary structure. The blue sector comprises a ring of residues within the core of the two β-barrels (A), the red sector comprises the S1 pocket and its environment (B), and the green sector comprises the catalytic mechanism of the protease located at the interface of the two β-barrels (C). In each panel, residues are gradient colored by strength of contribution to the sector (Figs. 1E and S3).
Figure 4
Figure 4
Relationship of sectors to primary, secondary, and tertiary structure. A, Positions colored by sector identity on the primary and secondary structure of a member of the S1A family (rat trypsin); the bar graph shows the global conservation of each position. B, the red, blue, and green sectors shown together on the three dimensional structure of rat trypsin (PDB 3TGI); sectors occupy different regions but make contacts with each other at a few positions. C, A space filling representation in the same view as panel B, showing that all sectors are similarity buried in the protein core. D, A slice through the core of rat trypsin at the level of the catalytic triad residues (labelled in white), with sector positions in colored spheres and the molecular surface of the protein in gray. Two blue sector positions (M104 and T229) and two red sector positions (C191 and G216, which is shared with the green sector) that are similarly buried and proximal to catalytic triad residues are highlighted. The mutational effects of these positions on catalytic power and fold stability are shown in Figure 5.
Figure 5
Figure 5
Mutational analysis of the red and blue sectors. A, Single alanine mutations at a set of red and blue sectors positions in rat trypsin, evaluated for effects on catalytic power, and thermal stability (Tm). Residues selected for single mutation were chosen to sample the range of statistical contributions to the red and blue sectors. Wild-type rat trypsin is indicated in black, and mutations are colored according to sector identity (position 216 belongs to both red and green sectors). White circles represent non-sector mutants. B, Multiple mutants within each sector evaluated as in A. In panels B and C, residue pairs selected for double mutation analysis were chosen to have mid-range single-mutation effects to permit assessment of additivity. Hswap indicates a multiple mutant largely within the red sector (Hedstrom et al., 1994). The multiple mutants show non-additive but selective effects on either stability or catalytic power. C, Two double mutant cycles between red and blue sectors, evaluated as described in A. The white circle indicates the effect of the double mutant predicted from the independent action of the single mutants, and the magenta circle is the measured effect of the double mutant. All error bars indicate standard deviation from at least three independent experiments.
Figure 6
Figure 6
Multidimensional sequence divergence within the serine protease family. Each stacked histogram shows the principal component of a sequence similarity matrix between the 442 members of the S1A family for which functional annotation is available. Similarity is calculated either for the red sector alone (18 positions, A), the blue sector (23 positions, B), the green sector (22 positions, C), or for all 223 sequence positions (D). In each case the left panel indicates the annotated primary catalytic specificity, the middle panel indicates organism type (invertebrate or vertebrate) from which the sequences originate, and the right panel indicates whether the protein has catalytic function. Sequence similarities within the red sector correlate well with catalytic specificity (A, left), but similarities within the blue or green sectors do not (B–C, left). For example, magenta, orange, and yellow bars and green bars indicated as granzymes (gr) A/K (all tryptic specificity) are grouped in A and not in B or C. In contrast, the similarities within the blue sector correlate with organism type (B, middle) while similarities within the red or green sectors do not (A and C, middle). Similarities with the green sector correlate with existence of catalytic mechanism (C, right), but similarities in the red or blue sectors do not (A–B, right). Similarity calculated over the whole sequence fails to separate sequences by catalytic specificity, organism type, or enzymatic mechanism (D).
Figure 7
Figure 7
Functional sectors in other protein families. SCA correlation matrices for the PDZ (A), PAS (B), SH2 (C), and SH3 (D) domain families after reduction of statistical and historical noises (C˜ij, analogous to Fig. 1E). In each case, the non-random correlations are described by sectors (labelled blue, red, and if applicable, green), each comprising less than 20% of total positions. A, The blue and red sectors of the PDZ family, respectively, shown as spheres within a molecular surface on a member of the protein family (PDB 1BE9 (Doyle et al., 1996); substrate peptide in green stick bonds). The peptide-binding pocket is bounded by he β2 strand, the α2 helix, and the “carboxylate binding loop” (CBL). Blue sector positions are either in direct contact with each other or are connected through interactions with substrate peptide and link a distant allosteric surface site on the α1 helix with the peptide-binding site (Lockless and Ranganathan, 1999; Peterson et al., 2004). Red sector positions comprise another contiguous group within the PDZ core, and correspond to a mechanism for regulating the conformation of the peptide-binding pocket (Mishra et al., 2007). B, The blue and red sectors of the PAS family, respectively, shown on a member of the protein family (PDB 2V0W (Halavaty and Moffat, 2007); bound flavin mononucleotide (FMN) ligand shown as yellow stick bonds). Both sectors in the PAS family are consistent with functional mechanisms. The blue sector connects the environment of FMN to two “output” regions undergoing allosteric conformational change (in magenta): the N-terminal helix and the C-terminal region of the core domain that attaches to the Jαhelix. Red sector positions comprise the linker connecting the PAS core to the Jαhelix. C, Three sectors in the SH2 family of phosphotyrosine binding domains (blue, red, and green, shown on PDB 1AYA). The blue sector is nearly fully buried in the core, the red sector is built around the P-Tyr and -1 side chains and extends to the αA helix (an allosteric surface, (Filippakopoulos et al., 2008)), while the green sector interacts with substrate positions 0 to +5. D, Two sectors in the SH3 family of poly-proline binding domains (blue and red, shown on PDB 2ABL). The blue sector defines the poly-proline binding site, while the red sector is nearly fully buried and connects the distal loop with a short 310 helix through residues in β-strand c.

References

    1. Agarwal PK, Billeter SR, Rajagopalan PT, Benkovic SJ, Hammes-Schiffer S. Network of coupled promoting motions in enzyme catalysis. Proc Natl Acad Sci U S A. 2002;99:2794–2799. - PMC - PubMed
    1. Altschul SF, Madden TL, Schaffer AA, Zhang J, Zhang Z, Miller W, Lipman DJ. Gapped BLAST and PSI-BLAST: a new generation of protein database search programs. Nucleic Acids Res. 1997;25:3389–3402. - PMC - PubMed
    1. Atchley WR, Wollenberg KR, Fitch WM, Terhalle W, Dress AW. Correlations among amino acid sites in bHLH protein domains: an information theoretic analysis. Mol Biol Evol. 2000;17:164–178. - PubMed
    1. Baird TT, Jr, Wright WD, Craik CS. Conversion of trypsin to a functional threonine protease. Protein Sci. 2006;15:1229–1238. - PMC - PubMed
    1. Bell JK, Goetz DH, Mahrus S, Harris JL, Fletterick RJ, Craik CS. The oligomeric structure of human granzyme A is a determinant of its extended substrate specificity. Nat Struct Biol. 2003;10:527–534. - PubMed

Publication types