

The mechanisms of vision loss associated with a cotton wool spot
- PMID: 19703485
- PMCID: PMC2783881
- DOI: 10.1016/j.visres.2009.08.017
The mechanisms of vision loss associated with a cotton wool spot
Abstract
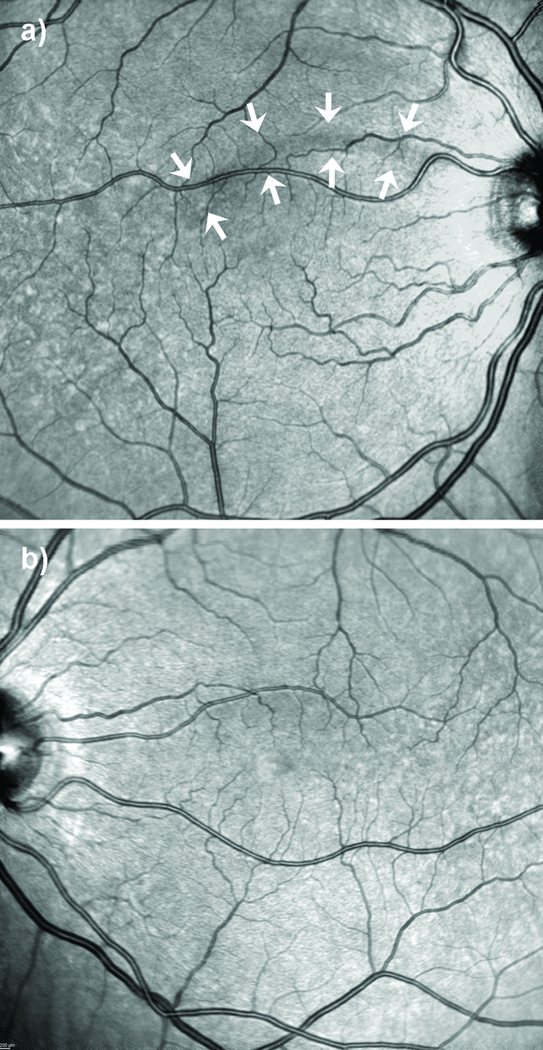
We characterized the perceptual, functional, and structural abnormalities associated with retinal ischemia during a cotton wool spot episode and its sequelae. The border of the visually salient field anomaly mirrored the quantitatively measured relative scotoma. Results of resolution perimetry and high resolution imaging indicated that there was a substantial loss of retinal ganglion cells within the affected region. A disruption in retinal nerve fiber arrangement was found at the cotton wool spot and within the arcuate relative scotoma. The presence of the arcuate relative scotoma is consistent with the hypothesis of failed signal transmission along the axons that pass through the cotton wool spot. The different levels of loss associated with the arcuate and focal scotomas indicate different underlying pathologies.
Figures


Similar articles
-
Nerve fiber bundle visual field defect resulting from a giant peripapillary cotton-wool spot.J Neuroophthalmol. 2001 Dec;21(4):276-7. doi: 10.1097/00041327-200112000-00010. J Neuroophthalmol. 2001. PMID: 11756859
-
Cotton-wool spot and optical coherence tomography of a retinal nerve fiber layer defect.Arch Ophthalmol. 2012 Jul;130(7):913. doi: 10.1001/archophthalmol.2011.1567. Arch Ophthalmol. 2012. PMID: 22776929 No abstract available.
-
Spectral domain optical coherence tomography findings in long-term silicone oil-related visual loss.Retina. 2015 Mar;35(3):555-63. doi: 10.1097/IAE.0000000000000325. Retina. 2015. PMID: 25127046
-
The microperimetry of resolved cotton-wool spots in eyes of patients with hypertension and diabetes mellitus.Arch Ophthalmol. 2011 Jul;129(7):879-84. doi: 10.1001/archophthalmol.2011.51. Arch Ophthalmol. 2011. PMID: 21746978
-
Nonorganic Visual Disorders.Int Ophthalmol Clin. 2019 Summer;59(3):141-152. doi: 10.1097/IIO.0000000000000281. Int Ophthalmol Clin. 2019. PMID: 31233421 Review. No abstract available.
Cited by
-
Genetic context modulates aging and degeneration in the murine retina.Mol Neurodegener. 2025 Jan 20;20(1):8. doi: 10.1186/s13024-025-00800-9. Mol Neurodegener. 2025. PMID: 39833899 Free PMC article.
-
Neural bandwidth of veridical perception across the visual field.J Vis. 2016;16(2):1. doi: 10.1167/16.2.1. J Vis. 2016. PMID: 26824638 Free PMC article.
-
Imaging retinal nerve fiber bundles using optical coherence tomography with adaptive optics.Vision Res. 2011 Aug 15;51(16):1835-44. doi: 10.1016/j.visres.2011.06.013. Epub 2011 Jun 22. Vision Res. 2011. PMID: 21722662 Free PMC article.
-
Adaptive optics retinal imaging--clinical opportunities and challenges.Curr Eye Res. 2013 Jul;38(7):709-21. doi: 10.3109/02713683.2013.784792. Epub 2013 Apr 26. Curr Eye Res. 2013. PMID: 23621343 Free PMC article. Review.
-
Single cotton wool spot as a late manifestation of head trauma.J Ophthalmic Vis Res. 2014 Apr;9(2):272-5. J Ophthalmic Vis Res. 2014. PMID: 25279131 Free PMC article.
References
-
- Alencar LM, Medeiros FA, Weinreb R. Progressive localized retinal nerve fiber layer loss following a retinal cotton wool spot. Semin Ophthalmol. 2007;22(2):103–104. - PubMed
-
- Anderson RS, Wilkinson MO, Thibos LN. Psychophysical localization of the human visual streak. Optom Vis Sci. 1992;69(3):171–174. - PubMed
-
- Anderson SJ, Hess RF. Post-Receptoral Undersampling in Normal Human Peripheral-Vision. Vision Research. 1990;30(10):1507–1515. - PubMed
Publication types
MeSH terms
Grants and funding
LinkOut - more resources
Full Text Sources
Medical
