Review
. 2009 Oct;41(10):1940-8.
doi: 10.1016/j.biocel.2009.02.016. Epub 2009 Mar 5.

From mitochondrial dynamics to arrhythmias

Affiliations
Review

From mitochondrial dynamics to arrhythmias

M A Aon et al. Int J Biochem Cell Biol. 2009 Oct.

Abstract

The reactive oxygen species (ROS)-dependent mitochondrial oscillator described in cardiac cells exhibits at least two modes of function under physiological conditions or in response to metabolic and oxidative stress. Both modes depend upon network behavior of mitochondria. Under physiological conditions cardiac mitochondria behave as a network of coupled oscillators with a broad range of frequencies. ROS weakly couples mitochondria under normal conditions but becomes a strong coupling messenger when, under oxidative stress, the mitochondrial network attains criticality. Mitochondrial criticality is achieved when a threshold of ROS is overcome and a certain density of mitochondria forms a cluster that spans the whole cell. Under these conditions, the slightest perturbation triggers a cell-wide collapse of the mitochondrial membrane potential, Delta psi(m), visualized as a depolarization wave throughout the cell which is followed by whole cell synchronized oscillations in Delta psi(m), NADH, ROS, and GSH. This dynamic behavior scales from the mitochondrion to the cell by driving cellular excitability and the whole heart into catastrophic arrhythmias. A network collapse of Delta psi(m) under criticality leads to: (i) energetic failure, (ii) temporal and regional alterations in action potential (AP), (iii) development of zones of impaired conduction in the myocardium, and, ultimately, (iv) a fatal ventricular arrhythmia.


Figures

Figure 1
Figure 1
Two-photon laser scanning fluorescence microscopy was used to image the epicardium of isolated perfused hearts loaded with 100nM TMRM. The (sub)cellular resolution of the two photon image of the ΔΨm signal (TMRM fluorescence, yellow pseudocolor) shows the myocytes still connected through gap junctions (arrows) in the myocardial syncytium and the extended mitochondrial network. Bar, 20 μm.
Figure 2
Figure 2
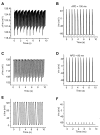
Simulation of mitochondrial oscillations effect on sarcolemmal action potential (AP) under physiological and pathophysiological conditions performed with the ECME-RIRR model. Panels A, C, E, show ΔΨm oscillatory behavior in the physiological (A: 138ms period; C: 203ms period) and pathophysiological (E: 770ms period) domains. Panels B, D, F, show the sarcolemmal AP, Vm. The control without oscillations had an APD of 170ms. The simulation parameters were: the fraction of electron transport diverted to ROS production, shunt=0.1 (i.e. 10%), and the amount of superoxide dismutase, EtSOD=0.8, 0.9 and 1.0 μM, respectively. All other parameters were as described in previous publications (Aon et al., 2006b, Cortassa et al., 2006, Cortassa et al., 2004).
Figure 3
Figure 3
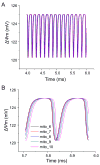
Simulation of mitochondrial network oscillatory behavior in the physiological domain. Panel A, oscillations of ~5mV amplitude and ~130 ms period were obtained with shunt = 0.1 and EtSOD = 0.8 mM) conditions. Panel B shows a zoom within two oscillatory cycles to highlight the sequential ΔΨm depolarization as well as repolarization. Shown are the results obtained with a linear network of eleven mitochondria. All other parameters were as described in previous publications(Aon et al., 2006b, Cortassa et al., 2006, Cortassa et al., 2004).
Figure 4
Figure 4
Representative rabbit heart left ventricular pressure tracings and ECG waveforms for the last 5s of reperfusion in: (A) control hearts, (B) hearts receiving 24 μM 4’Cl-DZP beginning 10 min prior to ischemia thru the duration of reperfusion, (C) hearts receiving a bolus of 4’Cl-DZP at the onset of reperfusion, and (D) hearts receiving 0.2 μM cyclosporin-A 10 min prior to ischemia through the duration of reperfusion. Reprinted from Brown et al. Cardiovascular Research (2008) 79, 141–149 (with permission from Oxford University Press).
Figure 5
Figure 5. Two-photon laser scanning fluorescence microscopy of the epicardium of a ~20min reperfused guinea pig heart after 30min global ischemia
The heart was loaded with 100nM TMRM and 4 μM CM-DCF before being subjected to the I/R protocol (see (Akar et al., 2005, Slodzinski et al., 2008)). The first two rows correspond to the ΔΨm (TMRM fluorescence, yellow fluorescence) and ROS (CM-DCF fluorescence, green fluorescence) signals whereas the autofluorescence (NADH, blue fluorescence) belongs to the row at the bottom. The sequence captures an extended region (from left to right) of the myocardial syncitium (~400 μm diameter: third frame from the left) with cells exhibiting completely depolarized mitochondria (first row) and a relatively oxidized NADH pool. We consider this region to be an “island of inexcitability” or “metabolic sink”. The cells surrounding the “metabolic sink” contain polarized mitochondria, high levels of ROS, and a reduced redox pool. The levels of ROS within the sink appear to be low probably because of release of the ROS probe after permeability transition pore opening (see (Aon et al., 2007a)). Bar, 40 μm.
Figure 6
Figure 6. From mitochondrial dynamics to arrhythmias
When subjected to oxidative stress mitochondria accumulate high levels of ROS until a threshold is reached, and the network attains criticality. Under these conditions, the slightest perturbation will drive the cell-wide spanning cluster containing high levels of ROS into an energetic blackout (ΔΨm depolarization) followed by high amplitude self-organized oscillations. This behavior escalates to the whole cell which is rendered inexcitable at the nadir of ΔΨm depolarization that, when extended to regions of depolarization in the myocardium like in I/R injury (see Fig. 5), leads to reperfusion-related arrhythmias. (The mitochondrion schematic on the far left was taken from www.cartage.org.lb/.../Mitochondria.htm whereas the panel on the far right was reprinted slightly modified from: Akar, F.G., Roth, B.J., and Rosenbaum, D.S. (2001) Am J Physiol Heart Circ Physiol 281:533-542, 2001)

References

    1. Akar FG, Aon MA, Tomaselli GF, O’Rourke B. The mitochondrial origin of postischemic arrhythmias. J Clin Invest. 2005;115:3527–3535. - PMC - PubMed
    1. Aon MA, Cortassa S. Chaotic dynamics, noise and fractal space in biochemistry. In: Meyers R, editor. Encyclopedia of Complexity and Systems Science. New York: Springer; 2009.
    1. Aon MA, Cortassa S, Akar FG, O’Rourke B. Mitochondrial criticality: a new concept at the turning point of life or death. Biochim Biophys Acta. 2006a;1762:232–240. - PMC - PubMed
    1. Aon MA, Cortassa S, Maack C, O’Rourke B. Sequential opening of mitochondrial ion channels as a function of glutathione redox thiol status. J Biol Chem. 2007a;282:21889–21900. - PMC - PubMed
    1. Aon MA, Cortassa S, Marban E, O’Rourke B. Synchronized whole cell oscillations in mitochondrial metabolism triggered by a local release of reactive oxygen species in cardiac myocytes. J Biol Chem. 2003;278:44735–44744. - PubMed

Publication types

MeSH terms

Substances