. 2009 Aug 24;186(4):589-600.
doi: 10.1083/jcb.200905085.

Crystal structure of the complete integrin alphaVbeta3 ectodomain plus an alpha/beta transmembrane fragment

Affiliations

Crystal structure of the complete integrin alphaVbeta3 ectodomain plus an alpha/beta transmembrane fragment

Jian-Ping Xiong et al. J Cell Biol. .

Abstract

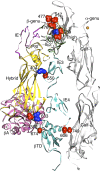
We determined the crystal structure of 1TM-alphaVbeta3, which represents the complete unconstrained ectodomain plus short C-terminal transmembrane stretches of the alphaV and beta3 subunits. 1TM-alphaVbeta3 is more compact and less active in solution when compared with DeltaTM-alphaVbeta3, which lacks the short C-terminal stretches. The structure reveals a bent conformation and defines the alpha-beta interface between IE2 (EGF-like 2) and the thigh domains. Modifying this interface by site-directed mutagenesis leads to robust integrin activation. Fluorescent lifetime imaging microscopy of inactive full-length alphaVbeta3 on live cells yields a donor-membrane acceptor distance, which is consistent with the bent conformation and does not change in the activated integrin. These data are the first direct demonstration of conformational coupling of the integrin leg and head domains, identify the IE2-thigh interface as a critical steric barrier in integrin activation, and suggest that inside-out activation in intact cells may involve conformational changes other than the postulated switch to a genu-linear state.


Figures

Figure 1.
Figure 1.
Construction, generation, and purification of 1TM-αVβ3. (A) Primary sequence of the exofacial residues and TM domain (underlined) of human αV and β3. The crystal structure of ΔTM-αVβ3 (Xiong et al., 2001) ends at Q956 in αV and G690 in β3 (closed arrows); ΔTM-αIIbβ3 terminates at the corresponding αIIb residue A958 and at G690 in β3 (Zhu et al., 2008). Open arrows point to the C-terminal ends of 1TM-αVβ3 (I967 and V696). G989 in the GFF motif is labeled. (B) Western blot after fractionation on 4–12% gradient SDS gels of LM609 mAb immunoprecipitates from insect cell-free supernatant under nonreducing (NR) and reducing (R) conditions. ΔTM and 1TM indicate ΔTM-αVβ3 and 1TM-αVβ3, respectively. Lanes 1 and 4 show molecular mass (mm) markers. The 1TM-αV and 1TM-β3 subunits migrated with those from ΔTM-αVβ3, as expected for the small (<1%) increase in mass caused by the additional C-terminal sequences. (C) Coomassie-stained purified 1TM-αVβ3 after fractionation on 4–12% gradient SDS gels under nonreducing conditions. Molecular mass markers in lane 1 are indicated.
Figure 2.
Figure 2.
Hydrodynamic analyses of 1TM-αVβ3 and ΔTM-αVβ3 by molecular sieve chromatography. A representative experiment (one of four) is shown. Purified ΔTM-αVβ3 or 1TM-αVβ3 in TBS, pH 7.4, containing 1 mM MgCl2 + 1 mM CaCl2 or 0.2 mM MnCl2 was analyzed. Each integrin was applied onto a precalibrated Superdex S-200 GL column, and Stokes radii were derived as described previously (Adair et al., 2005). Values next to the major peaks indicate peak elution volumes (in milliliters). A dashed line was added to emphasize the peak shifts. mAU, milli–absorbance unit.
Figure 3.
Figure 3.
Binding of 1TM-αVβ3 to physiological ligands and to the Fab fragment of the activation-sensitive mAb AP5. (A and B) Receptor-binding assay to immobilized ligand. Dose–response curves showing binding increasing concentrations of ΔTM- or 1TM-αVβ3 to wells coated with FN7–10 in the presence of 1 mM Mn2+ (A) or 1 mM Ca2+ + 1 mM Mg2+ (B). The data shown are from a representative experiment, one of two conducted. Each point was taken at the end of the assay, and the amount of integrin present was measured by quantitative ELISA (see Materials and methods for details). No binding took place to uncoated wells run in parallel (not depicted). (C) Molecular sieve chromatogram showing the stable binding of 1TM-αVβ3 to FN7–10 in solution containing 0.2 mM MnCl2. Peak elution volumes for the 1TM-αVβ3–FN complex and FN7–10 are 10.82 ml and 14.75 ml, respectively. (inset) Coomassie-stained SDS-PAGE under nonreducing conditions. Lane 1, molecular mass markers (in kilodaltons); lane 2, 1TM-αVβ3; lane 3, FN7–10; lane 4, blank; lane 5, FN7–10 from the faster peak; lane 6, blank; lane 7, 1TM-αVβ3–FN7–10 complex in the slower peak. An ∼1:1 integrin/FN molar ratio was calculated from the scanned gel (see Materials and methods), which is in agreement with previous results (Adair et al., 2005). (D) Molecular sieve chromatography of 1TM-αVβ3 with intact plasma FN in the presence of 0.2 mM Mn2+ or 1 mM Ca2+ + 1 mM Mg2+. In Mn2+-containing buffers, 1TM (Kav of 0.229; 11.58 ml) forms a complex with intact FN, which elutes at a Kav of 0.66 (9.0 ml). FN alone elutes as a discrete peak at a Kav of 0.127 (10.0 ml). In Ca2+/Mg2+ buffers, 1TM runs as a more compact molecule, and coelution with FN reveals no indication of complex formation (inset). (E) Molecular sieve chromatogram showing complex formation of 1TM-αVβ3 with the Fab fragment of mAb AP5 in TBS containing 2 mM CaCl2. The dashed line shows the peak elution volume of purified 1TM-αVβ3 alone run on the same column and in the same buffer. (inset) Coomassie-stained 12% SDS-PAGE under nonreducing conditions. Lane 1, molecular mass markers (in kilodaltons); lane 2, blank; lanes 3 and 5, purified 1TM-αVβ3 and AP5 Fab, respectively, before mixing; lane 4, 1TM-αVβ3–AP5 Fab complex from the slower peak. A 1:1 integrin/AP5 Fab molar ratio was calculated from the scanned gel (see Materials and methods). mAU, milli–absorbance unit.
Figure 4.
Figure 4.
New features of 1TM-αVβ3 crystal structure and hypothetical model of αVβ3 plus the complete TM domains (αVβ3-cTM). (A) Density map (in blue; contoured at 1.0 σ) of the exofacial and TM extensions. The superposed main chains of 1TM-αVβ3 and ΔTM-αVβ3 (only the lower parts of Calf-2 and βTD shown from each; Xiong et al., 2004) are in light and dark gray, respectively, except for the new exofacial and TM extensions of 1TM-αVβ3, which are shown in red, and the last residues in the ΔTM-αVβ3 structure (Q956 and G690), which are shown in green. (B) Density map (in blue; contoured at 1.0 σ) and main chain tracing of the β-genu (in red) in IE2. The orange sphere in this panel and in C represents the metal ion at the α-genu. (C) Ribbon diagram of the IE1–IE2 region in a similar orientation to that shown in B. Main chain tracings of IE1, IE2, and β-genu are in green, blue, and red, respectively. (D) Ribbon diagram showing electrostatic interactions at the IE2–thigh interface. Residues (shown in ball and stick representation) forming a salt bridge, main chain, or side chain H-bonds are labeled. Thigh and IE2 are labeled in gray and blue, respectively, with the β-genu in IE2 shown in red. Oxygen, nitrogen, and carbon atoms are in red, blue and green, respectively. Hydrogen bonds and salt bridges (distance cutoff, 3.5 Å) are represented with red dotted lines. (E) Structure alignment and Cys pairing of IE domains. The sequence housing the β-genu in IE2 is in blue. The secondary structure elements (strands are underlined, and a helix is represented by a cylinder) are shown. The atomic coordinates are deposited in the Protein Data Bank (3IJE). (F–H) Structure model of αVβ3 ectodomain plus the complete TM domains (αVβ3-cTM). The model is built by releasing the C termini in the 1TM-αVβ3 structure from their respective crystal contacts, such that extracellular P691 and P963 initiate the respective β3 and αV TM helices, which is consistent with the known propensity of prolines to strongly stabilize α-helical conformations (Senes et al., 2004). (F and G) The resulting movements included a 2.9-Å inward movement of P691 of β3 (F) and a rotation of αV’s Pro-rich loop at Q956, such that P963 initiates the αV TM helix (modeled after αIIb’s TM NMR structure; G; Lau et al., 2009). The structure model was energy minimized with Modeller (Fiser and Sali, 2003), and the αVβ3 TM side chains were optimized and repacked using Rosetta (Rohl et al., 2004). The ribbon diagrams in F and G were generated using PyMOL (DeLano Scientific LLC). (H) A ribbon diagram, which was generated using Chimera, of the αVβ3-cTM model showing the orientation of the ectodomain relative to the TM domains. The model predicts that the TM domains are at an ∼30° angle relative to the long axis of Calf-2, with ADMIDAS (adjacent to MIDAS) metal ion (green sphere) at an ∼45-Å distance from the plane parallel to the hypothetical membrane drawn at the Cα of β3′s Pro691. The α-genu and propeller metal ions are in orange.
Figure 5.
Figure 5.
Effect of mutations based on the TM-αVβ3 structure on integrin activation. The histogram (mean ± SD; n = 3) shows binding of Alexa Fluor 488–FN9–10 to WT and mutant surface-expressed αVβ3. The percentage of FN9–10-bound cells was expressed as a percentage of AP3-bound cells. Binding of WT and each of the mutants in Ca2+/Mg2+ was then expressed as a percentage of that obtained for the Mn2+-activated WT integrin, with the latter set at 100.
Figure 6.
Figure 6.
FLIM analysis of αVβ3 in live cells. (A) Histogram (mean ± SEM; n = 2) showing binding of subsaturating Alexa Fluor 488–labeled WT (open bars) and high affinity (h; shaded bars) FN10 to full-length WT αVβ3 stably expressed on K562 in the absence (−) or presence (+) of saturating amounts of unlabeled 17E6 Fab in 1 mM Mn2+ (see Materials and methods). (B) Isocratic molecular sieve elution profiles in Mn2+-containing TBS buffer. 1TM-αVβ3 (black) and its complexes with cilengitide (red), 17E6 Fab (blue), and 17E6 Fab complex followed by the addition of cilengitide to 10 µM (green) were resolved. The elution profile of 17E6 Fab alone is also shown (violet). Cilengitide runs in the column volume. Cilengitide triggers an increase of the apparent Stokes radius of the 1TM-αVβ3–17E6 Fab complex. mAU, milli–absorbance unit. (C) Histogram (mean ± SD) showing lifetimes (in picoseconds) of Alexa Fluor 488 fluorescence determined by FLIM in inactive (Ca2+) and active (Mn2+) full-length αVβ3. *, P < 0.0001 versus donor only. (D) Representative Alexa Fluor 488 fluorescence intensity of the unliganded WT integrin. The pseudocolored FLIM images represent donor fluorescence lifetimes on a pixel by pixel basis, where shorter lifetimes are located toward the red area of the spectrum and longer lifetimes toward the blue area. Bar, 8 µm.
Figure 7.
Figure 7.
Ribbon diagram showing functionally relevant ionic contacts in the 1TM-αVβ3 structure. IE2 makes several electrostatic contacts with two conserved loops at the bottom of the thigh domain. These include E500 from IE2 making a salt bridge with the conserved CC′ loop residue K503 and an H-bond with the invariant EF loop residue D550 (both from the thigh domain) and the β-genu residues E476 and D477 making H-bonds with the EF residue E547. Two salt bridges (R633–D393 and R404–D550) link the top and bottom of the hybrid domain to βTD and IE3, respectively. The small βTD–βA interface (S674–V332, in gray) and an H-bond between the βTD (D606) and Calf-2 (S749; Kamata et al., 2005) are also shown.

References

    1. Adair B.D., Xiong J.P., Maddock C., Goodman S.L., Arnaout M.A., Yeager M. 2005. Three-dimensional EM structure of the ectodomain of integrin αVβ3 in a complex with fibronectin.J. Cell Biol. 168:1109–1118 - PMC - PubMed
    1. Andrew S.A. 2002. Enzymatic digestion of monoclonal antibodies. The Protein Protocols Handbook. Second edition Walker J. M., editor Humana Press, Totowa, NJ: 1047–1052
    1. Arnaout M.A., Mahalingam B., Xiong J.-P. 2005. Integrin structure, allostery, and bidirectional signaling.Annu. Rev. Cell Dev. Biol. 21:381–410 - PubMed
    1. Aukhil I., Joshi P., Yan Y., Erickson H.P. 1993. Cell- and heparin-binding domains of the hexabrachion arm identified by tenascin expression proteins.J. Biol. Chem. 268:2542–2553 - PubMed
    1. Bacskai B.J., Skoch J., Hickey G.A., Allen R., Hyman B.T. 2003. Fluorescence resonance energy transfer determinations using multiphoton fluorescence lifetime imaging microscopy to characterize amyloid-beta plaques.J. Biomed. Opt. 8:368–375 - PubMed

Publication types