. 2009 Sep 16;101(18):1259-71.
doi: 10.1093/jnci/djp259. Epub 2009 Aug 24.

Influence of melanosome dynamics on melanoma drug sensitivity

Affiliations

Influence of melanosome dynamics on melanoma drug sensitivity

Kevin G Chen et al. J Natl Cancer Inst. .

Abstract

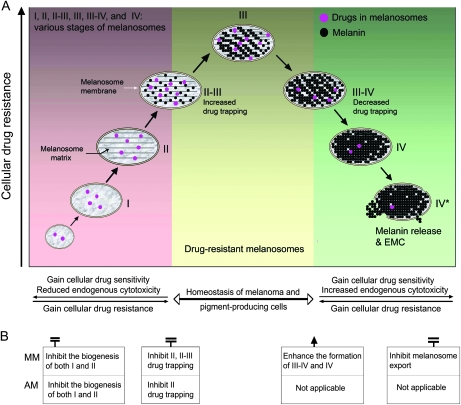
Background: Malignant melanomas are intrinsically resistant to many conventional treatments, such as radiation and chemotherapy, for reasons that are poorly understood. Here we propose and test a model that explains drug resistance or sensitivity in terms of melanosome dynamics.

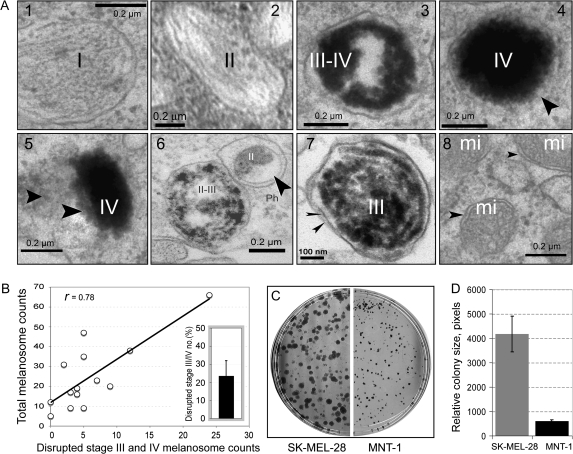
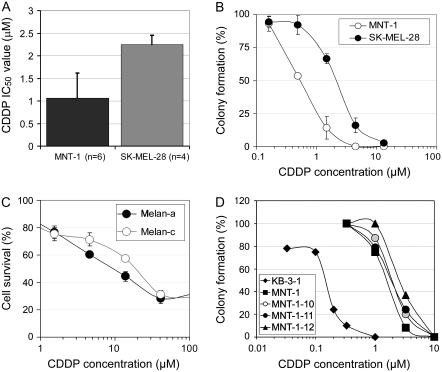
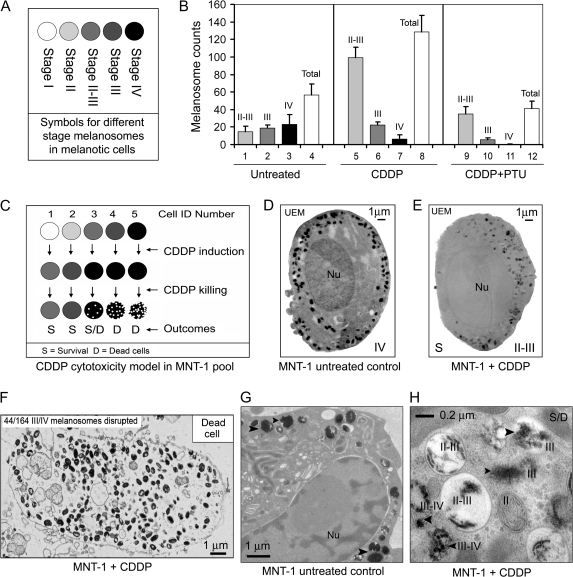
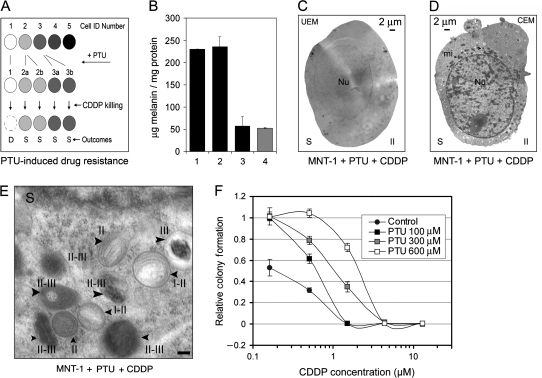
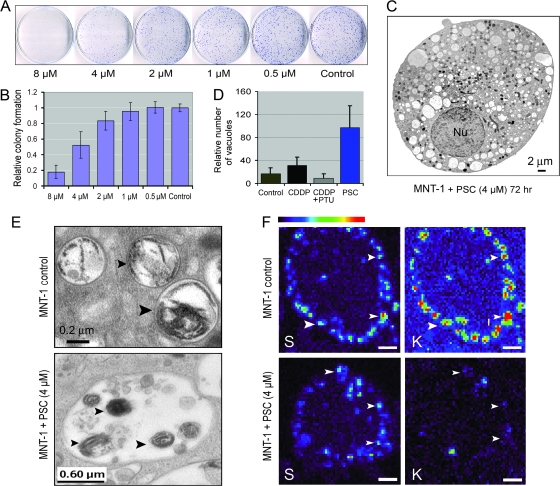
Methods: The growth and sensitivity to cisplatin of MNT-1 cells, which are melanotic and enriched with mature stage III and IV melanosomes, and SK-MEL-28 cells, which have only immature stage I and II melanosomes, were compared using clonogenic assays. Differences in pigmentation, melanosome stages, melanosome number, and cellular structures in different cell lines in response to various treatments were examined by electron microscopy. The relative numbers of melanosomes of different stages were compared after treatment with 1-phenyl-2-thiourea. The relationship between drug transporter function and endogenous melanogenic toxicity was assessed by treating cells with the cyclosporin analog PSC-833 and by assessing vacuole formation and cell growth inhibition. All statistical tests were two-sided.

Results: Endogenous melanogenic cytotoxicity, produced by damaged melanosomes, resulted in pronounced cell growth inhibition in MNT-1 cells compared with amelanotic SK-MEL-28 cells. The sensitivity to CDDP of MNT-1 cells was 3.8-fold higher than that of SK-MEL-28 cells (mean IC(50) for SK-MEL-28 and MNT-1 = 2.13 microM and 0.56 microM, respectively; difference = 1.57 microM, 95% confidence interval = 1.45 to 1.69; P = .0017). After treatment with 6.7 microM CDDP for 72 hours, the number of stage II-III melanosomes in surviving MNT-1 cells was 6.8-fold that of untreated cells. Modulation of MNT-1 cells to earlier-stage (II, II-III, III) melanosomes by treatment with the tyrosinase inhibitor 1-phenyl-2-thiourea dramatically increased CDDP resistance. Furthermore, PSC-833 principally suppressed MNT-1 melanotic cell growth via an elevation of autophagosome-like vacuolar structures, possibly by inhibiting melanosome membrane transporters.

Conclusions: Melanosome dynamics (including their biogenesis, density, status, and structural integrity) regulate the drug resistance of melanoma cells. Manipulation of melanosome functions may be an effective way to enhance the therapeutic activity of anticancer drugs against melanoma.


Figures

Figure 1
Figure 1
Melanogenesis and endogenous melanogenic cytotoxicity. A) Electron microscopic images showing the structures of melanosome matrix, melanin, and melanosomal membrane. The images are from the same experiment with representative melanosomes shown. The arrowhead(s) indicate(s) the defective membrane structure of a stage IV melanosome (A4), a disrupted melanosome with released melanin in the cytoplasm (A5), an autophagosome (A6), double melanosomal membranes isolated from secreted melanosomes after 6.7 μM CDDP treatment for 7 days (A7), and mitochondrial membranes used as controls to evaluate membrane integrity in our experimental conditions (A8). I–IV, indicate melanosomal stages, mi = mitochondria; Ph = autophagosome. B) Correlation of the number of damaged III or IV melanosomes with total melanosome numbers. Melanosomes were counted from intact conventional electron microscopy images (n = 14); inset, variations of disrupted stage III or IV melanosome number distribution in MNT-1 cells with 95% confidence intervals [CIs]. C) Clonogenic assays of cell growth of highly pigmented MNT-1 and of amelanotic SK-MEL-28 cells. D) Quantitative analysis of growth inhibition in MNT-1 and in SK-MEL-28 cells by measuring the relative size (pixel numbers) of colonies (n = 32); columns represent means and error bars correspond to 95% CIs.
Figure 2
Figure 2
Schema of melanosomal pathway–based cellular drug-resistance mechanisms. A) A mechanistic cellular model that delineates alterations of endogenous cytotoxicity and drug resistance or sensitivity in three major phases (color-coded areas) of the melanosomal pathway. The melanosome stages are further divided into stages I, II, II-III, III, III-IV, IV, and IV* (ie, damaged or disrupted stage IV). Arrows indicate the directionality of the cellular progress (ie, progression of melanogenesis, development of drug resistance or sensitivity, alterations of endogenous melanogenic cytotoxicity [EMC]). B) Therapeutic strategies based on melanosome biogenesis for both melanotic melanomas (MM) and amelanotic melanomas (AM). The molecular intervention points correspond to the melanogenic pathway presented in (A).
Figure 3
Figure 3
Melanosome stages, melanin content, and cisplatin (CDDP) sensitivity. A) CDDP resistance of SK-MEL-28 (containing stage I and II melanosomes) and of MNT-1 cells (enriched with stage III and IV melanosomes). IC50 values were determined from multiple independent experiments as indicated. Columns represent mean IC50 values and error bars 95% confidence intervals (CIs). B) Clonogenic assays of CDDP sensitivity in SK-MEL-28 and in MNT-1 cells maintained in high-density culture conditions. Approximately 1000 highly pigmented cells were seeded in 60-mm cell culture dishes. The cells were treated on the 3rd day (to ensure proper plating efficiency and vitality of the cells) with CDDP for 3 days. We counted cells in all dishes on day 12 after removal of the drug-containing medium in this experiment. Representatives of triplicate dishes of each treatment are shown in Supplementary Figure 3, A (available online). Cytotoxic dose–response curves were plotted, with each point corresponding to the mean value and error bars indicating 95% CIs. One of two similar experiments is shown. C) Drug sensitivity in immortal mouse melanocytes (melan-a, wild type) and their hypopigmented mutant (melan-c, albino). Approximately 5000 cells per well were seeded in 96-well plates. The cells were treated on the 3rd day (to ensure proper plating efficiency and vitality) with CDDP for 72–96 hours. Cytotoxicity was measured using the 3-(4,5-dimethylthiazol-2-yl)-2,5-diphenyl tetrazolium assay as previously described (28); each point corresponds to the mean value of quadruplicate determinations in each independent experiment and error bars indicate 95% CIs. One of two similar experiments is shown. D) Clonogenic assays of CDDP sensitivity in MNT-1 subclones. KB-3-1 cells (derived from the HeLa cervical adenocarcinoma cell line) were used as a nonmelanoma control. Approximately 300 cells were seeded in 60-mm cell culture dishes. The cells were treated with CDDP for 10 days. Cytotoxic dose–response curves were determined as described in (B). One of two similar experiments is shown. A comprehensive analysis of cytotoxic drug sensitivity and its association with melanin content is provided in Supplementary Table 1 (available online).
Figure 4
Figure 4
Manipulation of melanosome status by cisplatin (CDDP) in MNT-1 cells. A) Symbols for different stages of melanosome in MNT-1 cells. B) Variations of melanosome stages and numbers in untreated MNT-1 cells (n = 11) and MNT-1 cells treated with 6.7 μM CDDP for 72 hours in the presence (n = 5) or absence (n = 4) of 600 μM 1-phenyl-2-thiourea (PTU). The number of melanosomes at different stages (II-III to IV) after drug treatment was counted from unstained micrographs. Mean melanosome numbers and 95% confidence intervals from four to 11 montaged electron microscopy (EM) graphs are shown. C) A CDDP cytotoxicity model for MNT-1 cells that have different melanosome status. The schematic illustrates that a treatment with a sublethal dose of CDDP (eg, 6.7 μM) promotes the maturation of late-stage melanosomes. Sustained cytotoxic effects of CDDP disrupt the late-stage melanosomes, maximize EMC, and cause cell death in stage III/IV-enriched cells. D) An unstained electron micrograph (UEM) of MNT-1 cells with predominantly stage III or IV melanosomes. E) Stage II-III melanosomes in CDDP-resistant MNT-1 cells after 6.7 μM CDDP treatment for 72 hours. F) An EM image of a dead MNT-1 cell after the CDDP treatment described above. G) UEM image of MNT-1 control cells. Arrowheads indicate some stage IV melanosomes. H) MNT-1 cells treated with CDDP with disrupted stage III/IV melanosomes. D = dead cells; ID = identification; Nu = nucleus; S = survival or CDDP-resistant cells; S/D = CDDP-treated cells with an uncertain survival status.
Figure 5
Figure 5
Manipulation of melanosome status by 1-phenyl-2-thiourea (PTU) and cisplatin (CDDP) in MNT-1 cells. A) A hypothetical model of PTU-induced drug resistance in MNT-1 cells. Symbols, the same as in Figure 4, A, represent different stages of melanosomes (stage I–IV) in five individual MNT-1 cells, which illustrate melanosome stage transitions that occur in response to treatment with the drug. A clonal expansion of individual cells (eg, from cell numbers 2 and 3) enriched with stage II (ie, in cell 2a and 2b) and stage III (ie, in cell 3a and 3b) melanosomes would lead to increased cellular resistance to the drug. Cells at stage I (ie, cell number 1) or IV (eg, cell number 5) would be induced to have predominant stage II and III melanosomes by PTU, respectively. Cells that have predominant stage II and III melanosomes would be survivors (S) of CDDP treatment. B) Melanin content in untreated MNT-1 cells (column 1) and in MNT-1 cells treated for 72 hours with 100 μM (column 2) or 600 μM (column 3) PTU. KB-3-1 cells (column 4) were used as a nonmelanoma control. Columns represent the mean values of triplicate determinants and error bars correspond to 95% confidence intervals (CIs). C and D) Unstained electron microscopy (UEM) and conventional electron microscopy (CEM) images of MNT-1 cells simultaneously treated with PTU (600 μM) and CDDP (6.7 μM). E) Enlarged areas of an MNT-1 CEM micrograph, with arrowheads indicating stage II and stage II-III melanosomes induced by simultaneous treatment with PTU and CDDP. Scale bar = 0.2 μm. F) CDDP sensitivity in MNT-1 cells in the presence of PTU. Approximately 1000 MNT-1 cells were seeded in 60-mm cell culture dishes. Clonogenic assays were performed as described in Figure 3, B. Cytotoxicity curves were determined by counting surviving colonies (presented in Supplementary Figure 3, B, available online) with each point corresponding to the mean number of colonies and error bars indicating 95% CIs. One of two similar experiments is shown. mi = mitochondria; Nu = nucleus.
Figure 6
Figure 6
The effects of cyclosporin analog PSC-833 (PSC) on melanotic cell growth and EMC-related autophagy. A) Clonogenic assays of the effect of PSC on MNT-1 cell growth. The procedures were the same as described in Figure 3, B. Representatives of triplicate dishes of each treatment are shown. B) Quantitative analysis was based on clonogenic assays shown in (A). Columns represent mean colony number of three culture dishes; error bars correspond to 95% confidence intervals [CIs]. One of two similar experiments is shown. C) An electron microscopy (EM) image of a 4-μM PSC-treated cell after 72 hours. D) Autophagosome-like vacuolar structures in untreated MNT-1 cells and in MNT-1 cells treated with cisplatin (CDDP), CDDP and 1-phenyl-2-thiourea (PTU), and PSC. Columns represent mean vacuolar numbers from more than 13 EM images (or cells) of each treatment. Error bars correspond to 95% CIs. E) High-magnification image of untreated MNT-1 cells and PSC-treated MNT-1 cells. Arrowheads in the upper panel indicate two melanosomes with disorganized melanosomal matrices, whereas arrowheads in the lower panel point to a melanosome-containing autophagosome. F) X-ray mapping of potassium (K) in untreated MNT-1 cells or in cells treated with 4 μM PSC for 72 hours; Sulfur (S) was used as a melanosomal marker for MNT-1 cells because of its specific melanosomal accumulation, which has been previously described (8). Arrowheads point to melanosomes. Scale bars = 2 μm. Nu = nucleus.

References

    1. Atkins MB, Buzaid AC, Houghton AN. Chemotherapy and biochemotherapy. In: Balch C, Houghton A, Sober A, Soong S, editors. Cutaneous Melanoma, 4th Edition. St. Louis, MO: Quality Medical Publishing; 2003. pp. 589–604.
    1. Quan WDY. Melanoma and other skin malignancies. In: Skeel RT, editor. Handbook of Cancer Chemotherapy , 6th Edition. Philadelphia, PA: Lippincott Williams and Wilkins; 2003. pp. 360–377.
    1. Tsao H, Atkins MB, Sober AJ. Management of cutaneous melanoma. N Engl J Med. 2004;351(10):998–1012. - PubMed
    1. Morgan RA, Dudley ME, Wunderlich JR, et al. Cancer regression in patients after transfer of genetically engineered lymphocytes. Science. 2006;314(5796):126–129. - PMC - PubMed
    1. Lewis KD, Robinson WA, McCarter M, et al. Phase II multicenter study of neoadjuvant biochemotherapy for patients with stage III malignant melanoma. J Clin Oncol. 2006;24(19):3157–3163. - PubMed

Publication types

MeSH terms