. 2009 Sep 8;106(36):15308-13.
doi: 10.1073/pnas.0903005106. Epub 2009 Aug 21.

Nucleosome disassembly intermediates characterized by single-molecule FRET

Affiliations

Nucleosome disassembly intermediates characterized by single-molecule FRET

Alexander Gansen et al. Proc Natl Acad Sci U S A. .

Abstract

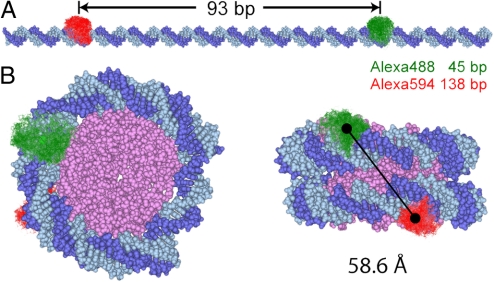
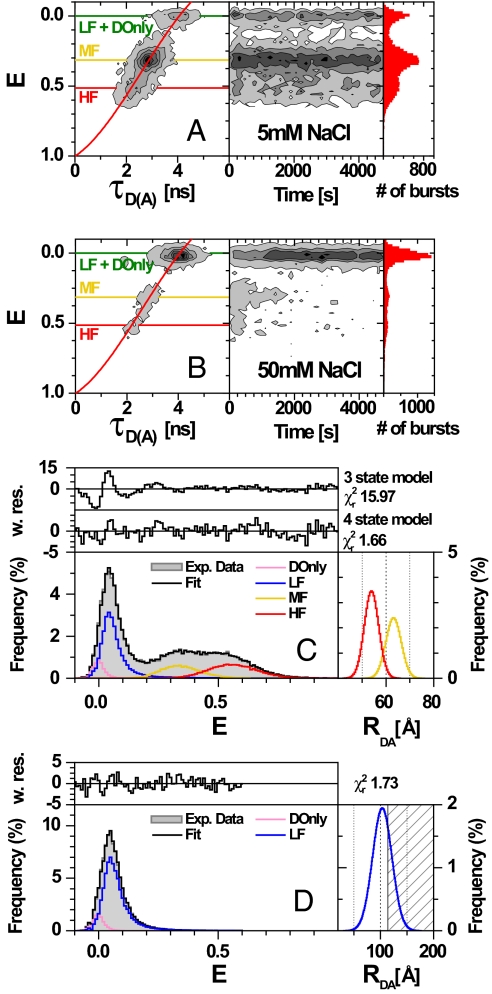
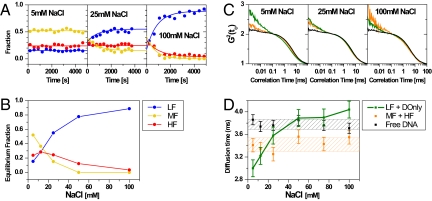
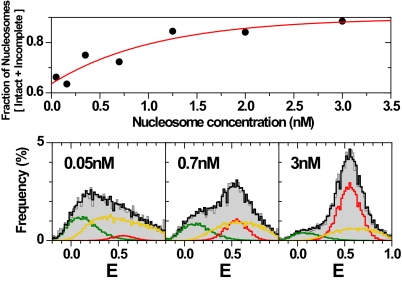
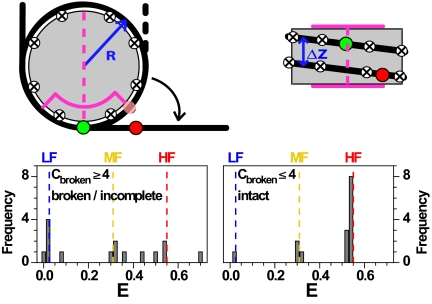
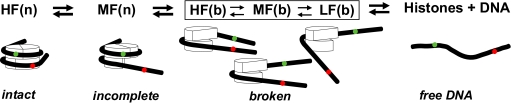
The nucleosome has a central role in the compaction of genomic DNA and the control of DNA accessibility for transcription and replication. To help understanding the mechanism of nucleosome opening and closing in these processes, we studied the disassembly of mononucleosomes by quantitative single-molecule FRET with high spatial resolution, using the SELEX-generated "Widom 601" positioning sequence labeled with donor and acceptor fluorophores. Reversible dissociation was induced by increasing NaCl concentration. At least 3 species with different FRET were identified and assigned to structures: (i) the most stable high-FRET species corresponding to the intact nucleosome, (ii) a less stable mid-FRET species that we attribute to a first intermediate with a partially unwrapped DNA and less histones, and (iii) a low-FRET species characterized by a very broad FRET distribution, representing highly unwrapped structures and free DNA formed at the expense of the other 2 species. Selective FCS analysis indicates that even in the low-FRET state, some histones are still bound to the DNA. The interdye distance of 54.0 A measured for the high-FRET species corresponds to a compact conformation close to the known crystallographic structure. The coexistence and interconversion of these species is first demonstrated under non-invasive conditions. A geometric model of the DNA unwinding predicts the presence of the observed FRET species. The different structures of these species in the disassembly pathway map the energy landscape indicating major barriers for 10-bp and minor ones for 5-bp DNA unwinding steps.


Conflict of interest statement

The authors declare no conflict of interest.

Figures

Fig. 1.
Fig. 1.
Internal labeling of nucleosomes. (A) Extended nucleosomal DNA duplex [D strand (dark blue), A strand (light blue)]. The conformational space of the D and A dyes from MD simulations is shown in green and red respectively. The dye positions and the number of separating basepairs of 93 are given for the D strand. (B) Nucleosome viewed from top (Left) and from the side (Right), based on the crystal structure 1KX5 from the RCSB Protein Data Bank (2) and fluorophore positions from (16) (see SI Appendix, section 2.6). Only the core of the histone (magenta) is shown for simplicity. The solid line connects the centers of mass (black circles) of the fluorophores' accessible space.
Fig. 2.
Fig. 2.
MFD plots of single nucleosomes at different NaCl concentrations. The number of molecules (fluorescent bursts) in each bin is gray scale colored from white (lowest) to black (highest). (A and B) Intensity-based FRET efficiency is plotted versus donor lifetime in the presence of the acceptor, τD(A), (Left) and versus the measurement time (Right). FRET efficiencies were obtained from raw signals S by correcting for green and red background (BG = 2.3 kHz, BR = 1.2 kHz), spectral cross-talk (α = 0.07), detection efficiencies (gG/gR = 0.58), direct A excitation (DE = 1.35 kHz) and the fluorescence quantum yields (ΦFD(0) = 0.70 and ΦFA = 0.70) (see SI Appendix, Eqs. 3 and 4). The red overlaid line (E = 1 − (0.00479 + 0.4813τD(A) + 0.26694τD(A)2 − 0.03435τD(A)3)/4.1) takes linker movements into account (see SI Appendix, Eq. 10). (C and D) PDA of the FRET efficiency of nucleosomes at 25 mM NaCl (C) and free DNA at 5 mM NaCl (D) with the data histogram (gray) for time intervals of 3 ms. The black solid line is the fit to a 4 state model with HF, MF, LF, DOnly (red, yellow, blue, and pink lines, respectively). Weighted residuals are displayed on top of each E histogram. The 1 σ standard deviations were determined by reduced χ2 surfaces (SI Appendix, section 2.4 and Fig. S2E). The fit also includes corrections for multimolecule events. Gaussian distributions for the FRET species yielded mean distances RDA, half-widths HW and fractions xi. The corresponding DA distance distributions of the populations are displayed in the Right Inset. Nucleosomes (C): Four-state model with HF (RDA = 54.0 ± 0.4 Å, HW = 3.0 ± 0.3 Å, xHF = 0.26 ± 0.03), MF (RDA = 63.1 ± 0.4 Å, HW = 3.2 ± 0.3 Å, xMF = 0.19 ± 0.03), LF (RDA = 119 ± 2 Å, HW = 31 ± 2 Å, xLF = 0.47 ± 0.04) and DOnly (E = 0, xDOnly = 0.08 ± 0.01). The residuals of the fit to a 3 and 4 state model are shown for comparison. The corresponding DA distance distributions of the HF and MF populations are displayed in the Right Inset. Free DNA (D): Two-state model with LF (RDA = 103 Å, HW = 18 Å, xLF = 0.89) and DOnly (E = 0, xDOnly = 0.11).
Fig. 3.
Fig. 3.
Stability of HF and MF species (A) Time evolution of the 3 different DA species (HF, MF, LF) obtained by PDA for 5, 25 (e.g., Fig. S2 A and B) and 100 mM NaCl. The solid lines are fits using Eq. 18 (SI Appendix, section 3.3) with the results listed in Table S4 a and b. (B) Equilibrium fractions of HF, MF and LF (DOnly not shown) as a function of NaCl concentration. (C) Subensemble-filtered FCS curves for free DNA (black), LF+DOnly (green) and HF+MF (orange) species at 5, 25 and 100 mM NaCl. (D) Characteristic FCS diffusion times of the subspecies as a function of NaCl concentration (for all curves see Fig. S4). The data were obtained by fitting the curves with Eq. 14 (SI Appendix, section 2.5). Shaded areas indicate the 1-σ standard deviation.
Fig. 4.
Fig. 4.
Unfolding of nucleosomes. (Upper) Concentration-dependent stability of nucleosomes at 100 mM NaCl as a function of total nucleosome concentration. For each data point 50 pM labeled nucleosomes were mixed with unlabeled 601 nucleosomes to obtain the final concentration and measured for 60 min (11). The fractions of the different species were computed through PDA as shown below with the results listed in Table S4c. The red line is a single exponential fit: y = 0.988–0.262 × exp(−x/1.083). (Lower) Three representative E-distributions are shown for 0.05, 0.7 and 3 nM nucleosomes. The fit (black line) of the E-distributions (gray histograms) is decomposed by PDA into 3 populations: HF (red line), MF (yellow line) and combined LF+DOnly (green line). The following parameters were fixed in the PDA fits: HF (RHF = 54.5 Å, HWHF = 3.02 Å; obtained at 3 nM), LF (RLF = 75.1 Å, HWLF = 10.3 Å; obtained from free DNA (data not shown)) and DOnly, (single distance RDA → ∞). Only the properties of MF (RMF, HWMF) and the fractions x of all species were varied. The fit results are: (0.05 nM) RMF = 57.3 Å, HWMF = 12 Å, xMF = 0.61, xHF = 0.05, xLF = 0.24, xDOnly = 0.10; (0.7 nM) RMF = 53.6 Å, HWMF = 9.4 Å, xMF = 0.47, xHF = 0.25, xLF = 0.20, xDOnly = 0.08; (3 nM) RMF = 52.5 Å, HWMF = 8.7 Å, xMF = 0.27, xHF = 0.61, xLF = 0.07, xDOnly = 0.04.
Fig. 5.
Fig. 5.
Geometric model for nucleosome unfolding. Nucleosomal DNA (black line) is wrapped around a cylindrical histone core (gray). Dyad (magenta dashed line), region with strong interactions (magenta line), contact points (circled crosses), donor and acceptor dyes (green and red spheres). In the top view, the semitransparent red circle represents the position of the acceptor in the fully wrapped nucleosome. The detached DNA segments were straight and tangential to the nucleosome core at the detachment point(s). Model parameters were estimated from the X-ray structure: Effective nucleosome radius R = 40 Å, rise per turn Δz = 45 Å, 80 bp per nucleosome turn, DNA length of 170 bp, donor dye position at 46.5 bp, acceptor dye position 136.5 bp, scaled Förster radius ßR0 = 61.2 Å with ß = 1.1 (for details see SI Appendix, section 2.7). (Lower) Possible FRET efficiency values from the geometrical model with contact points 10 bp apart, showing values obtained for the loss of ≤4 contact points (Right) and ≥4 contact points (Left).
Fig. 6.
Fig. 6.
Diagram of the possible nucleosomal species. Nucleosomes lacking the contact between DNA and one H2A/H2B dimer are indicated as Incomplete, whereas nucleosomes lacking the contact with >1 H2A/H2B dimer are indicated as Broken. Depending on the progress of disassembly the width of the E-distributions of the species LF, MF and HF can be either narrow (n) or broad (b).

References

    1. Olins AL, Olins DE. Spheroid chromatin units (v bodies) Science. 1974;183:330–332. - PubMed
    1. Davey CA, Sargent DF, Luger K, Maeder AW, Richmond TJ. Solvent mediated interactions in the structure of the nucleosome core particle at 1.9 Å resolution. J Mol Biol. 2002;319:1097–1113. - PubMed
    1. Kulic IM, Schiessel H. Nucleosome repositioning via loop formation. Biophys J. 2003;84:3197–3211. - PMC - PubMed
    1. Lovullo D, Daniel D, Yodh J, Lohr D, Woodbury NW. A fluorescence resonance energy transfer-based probe to monitor nucleosome structure. Anal Biochem. 2005;341:165–172. - PubMed
    1. Tóth K, Brun N, Langowski J. Chromatin compaction at the mononucleosome level. Biochemistry. 2006;45:1591–1598. - PubMed

Publication types

LinkOut - more resources