. 2009 Sep 1;106(35):14926-31.
doi: 10.1073/pnas.0905443106. Epub 2009 Aug 18.

Mapping accessible chromatin regions using Sono-Seq

Affiliations

Mapping accessible chromatin regions using Sono-Seq

Raymond K Auerbach et al. Proc Natl Acad Sci U S A. .

Abstract

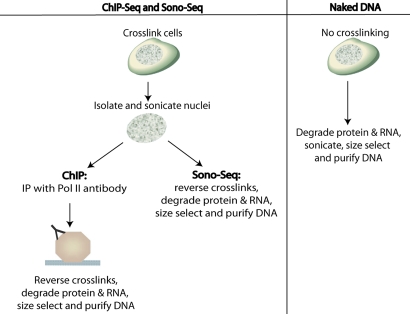
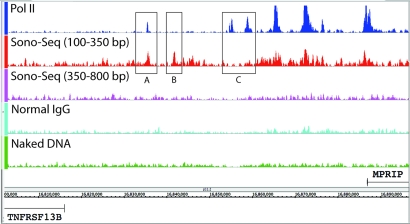
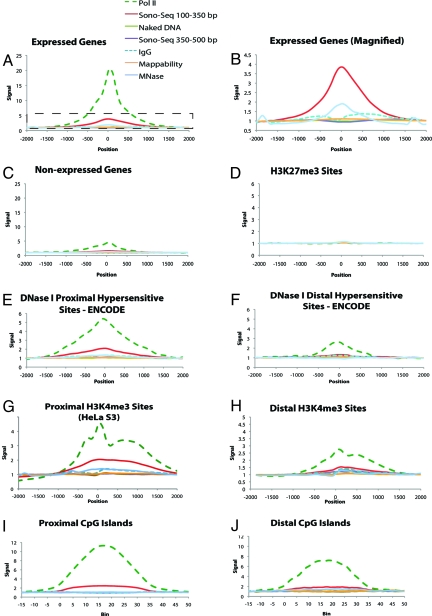
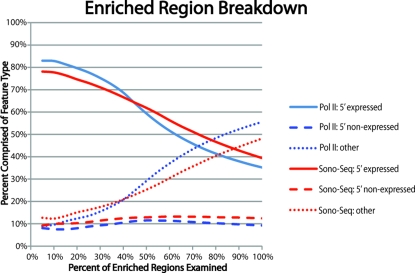
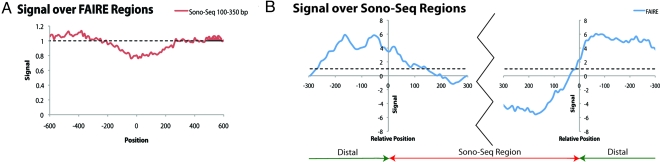
Disruptions in local chromatin structure often indicate features of biological interest such as regulatory regions. We find that sonication of cross-linked chromatin, when combined with a size-selection step and massively parallel short-read sequencing, can be used as a method (Sono-Seq) to map locations of high chromatin accessibility in promoter regions. Sono-Seq sites frequently correspond to actively transcribed promoter regions, as evidenced by their co-association with RNA Polymerase II ChIP regions, transcription start sites, histone H3 lysine 4 trimethylation (H3K4me3) marks, and CpG islands; signals over other sites, such as those bound by the CTCF insulator, are also observed. The pattern of breakage by Sono-Seq overlaps with, but is distinct from, that observed for FAIRE and DNase I hypersensitive sites. Our results demonstrate that Sono-Seq can be a useful and simple method by which to map many local alterations in chromatin structure. Furthermore, our results provide insights into the mapping of binding sites by using ChIP-Seq experiments and the value of reference samples that should be used in such experiments.


Conflict of interest statement

The authors declare no conflict of interest.

Figures

Fig. 1.
Fig. 1.
Steps used to prepare ChIP DNA, Sono-Seq DNA, and naked DNA.
Fig. 2.
Fig. 2.
Signal map showing Pol II ChIP DNA, Sono-Seq DNA (small and large fragment sizes), normal IgG, and naked DNA. All signals are in HeLa S3 cells. Signal levels between positions 16,802,000 and 16,896,000 of chromosome 17 are shown. Tracks are scaled based on the number of uniquely mapped reads obtained for each sample type. Both TNFRSF13B and MPRIP are not expressed in HeLa S3 based on RNA-Seq data (14). Several regions of disagreement between Sono-Seq and Pol II signal are shown, such as a large Sono-Seq peak with a less pronounced Pol II peak (A), the absence of a Pol II peak and the presence of a Sono-Seq peak (B), and Pol II peaks without corresponding Sono-Seq peaks (C).
Fig. 3.
Fig. 3.
Aggregation plots depicting the average ChIP signal across a variety of genomic features. Vertical axis units are consistent between all plots. Horizontal axis units are given in nucleotides from the feature start site in plots A–H and in bins each representing 1/35th of the feature size in plots I and J. Frame B is a magnified view of the regions enclosed by the dotted box in frame A in which Pol II is removed and scales are altered to allow for better comparison between reference sample types. In all figures, position/bin 0 corresponds to the start of the target feature. For plots E–J, proximal is defined as lying within ±2.5 Kb of an Ensembl gene. Values are given in “fold enrichment” compared against a background signal (see Materials and Methods). A value of 1.0 indicates signal equal to background. The signal was calculated in Pol II, two different size selections of Sono-Seq DNA, naked DNA, normal IgG, and MNase-digested DNA. Mappability is a measure of how well reads are mapped to the features being compared (see Materials and Methods). A mappability of 1.0 indicates a mappability equal to that of background.
Fig. 4.
Fig. 4.
A rank-order plot depicting the percentage of Sono-Seq- and Pol II-enriched regions located proximal and distal to genes (see Materials and Methods). Regions most highly enriched by Sono-Seq typically lie proximal to the TSSs of expressed genes. Enrichment over promoter regions of nonexpressed genes remains constant, whereas enriched regions lying distal to known promoter regions are ranked lower (i.e., have lower scores).
Fig. 5.
Fig. 5.
Sono-Seq differs from FAIRE. (A) Aggregation of signal from yeast Sono-Seq DNA (selected at 100–350 bp) over regions enriched in yeast FAIRE. The Sono-Seq signal is depressed over regions enriched by FAIRE. (B) Aggregation of FAIRE DNA signals over regions enriched in Sono-Seq. The FAIRE signal appears to be enriched in regions flanking Sono-Seq sites. All data shown in this figure originate from S. cerevisiae chromosome 3. In all figures, position 0 corresponds to the start of the target feature and the signal is given in fold-enrichment, as compared with background. Yeast FAIRE data are from Hogan et al. (20).

References

    1. Nagy PL, Cleary ML, Brown PO, Lieb JD. Genomewide demarcation of RNA polymerase II transcription units revealed by physical fractionation of chromatin. Proc Natl Acad Sci USA. 2003;100:6364–6369. - PMC - PubMed
    1. Crawford GE, et al. DNase-chip: A high-resolution method to identify DNase I hypersensitive sites using tiled microarrays. Nat Methods. 2006;3:503–509. - PMC - PubMed
    1. Giresi PG, Kim J, McDaniell RM, Iyer VR, Lieb JD. FAIRE (Formaldehyde-Assisted Isolation of Regulatory Elements) isolates active regulatory elements from human chromatin. Genome Res. 2007;17:877–885. - PMC - PubMed
    1. Horak CE, Snyder M. ChIP-chip: A genomic approach for identifying transcription factor binding sites. Methods Enzymol. 2002;350:469–483. - PubMed
    1. Iyer VR, et al. Genomic binding sites of the yeast cell-cycle transcription factors SBF and MBF. Nature. 2001;409:533–538. - PubMed

Publication types

Associated data