. 2009 Sep 1;106(35):15043-8.
doi: 10.1073/pnas.0904400106. Epub 2009 Aug 14.

Melatonin modulates visual function and cell viability in the mouse retina via the MT1 melatonin receptor

Affiliations

Melatonin modulates visual function and cell viability in the mouse retina via the MT1 melatonin receptor

Kenkichi Baba et al. Proc Natl Acad Sci U S A. .

Abstract

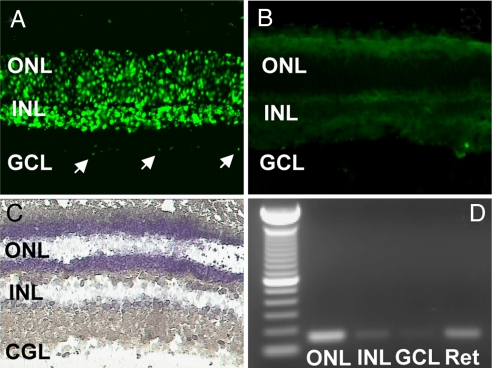
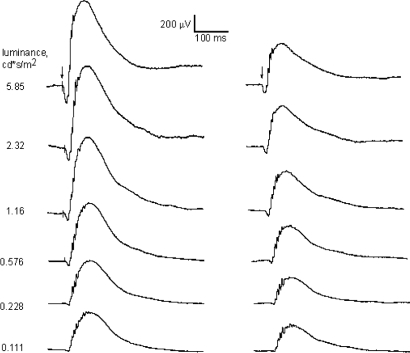
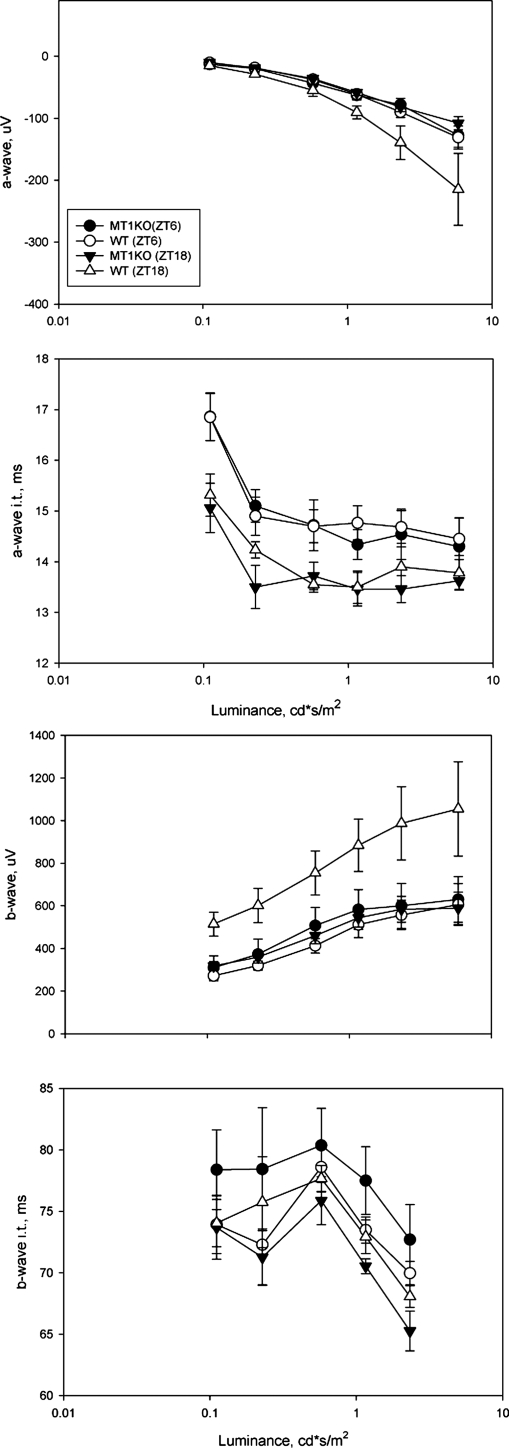
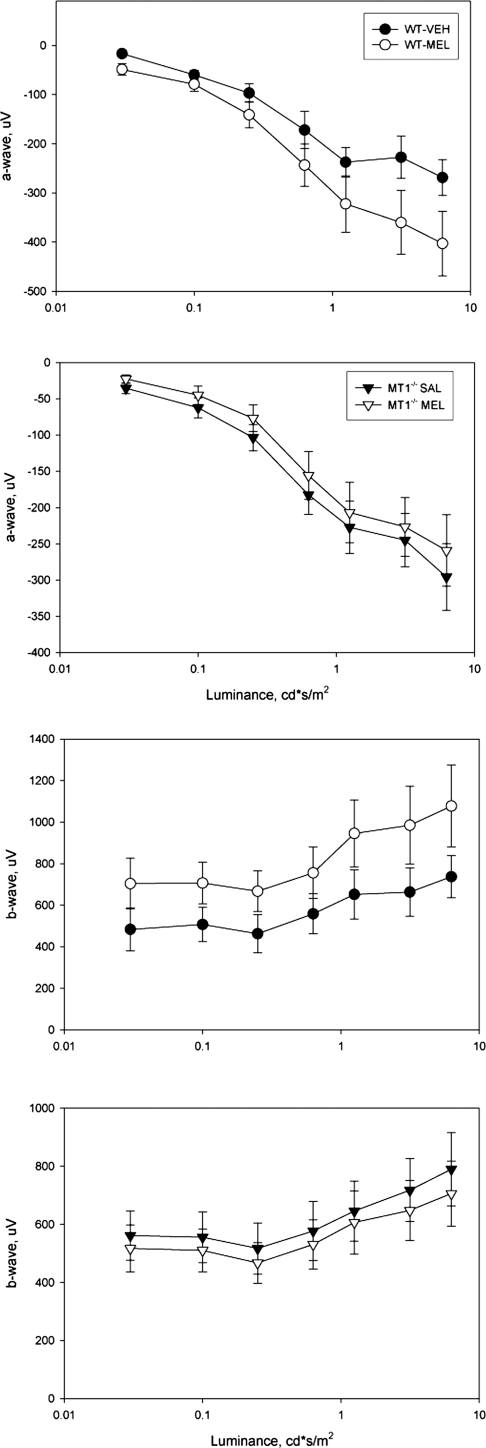
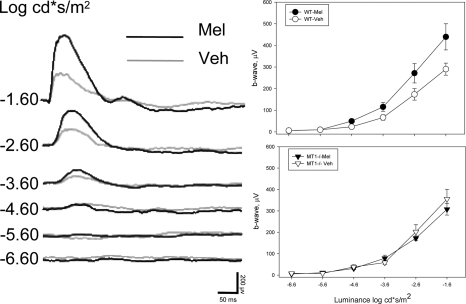
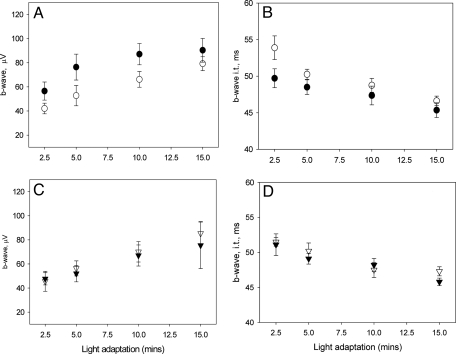
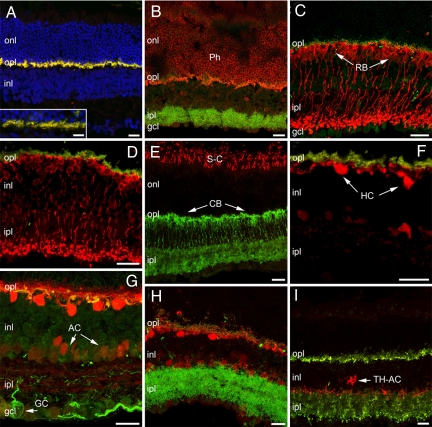
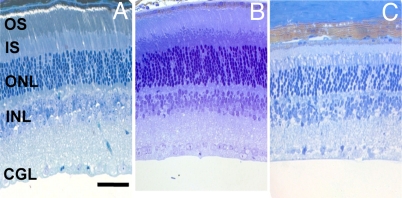
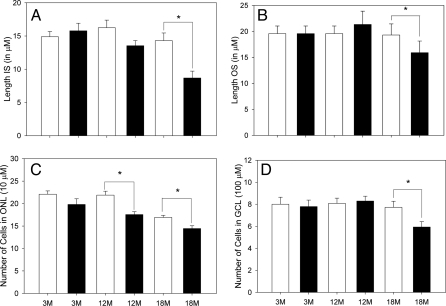
A clear demonstration of the role of melatonin and its receptors in specific retinal functions is lacking. The present study investigated the distribution of MT1 receptors within the retina, and the scotopic and photopic electroretinograms (ERG) and retinal morphology in wild-type (WT) and MT1 receptor-deficient mice. MT1 receptor transcripts were localized in photoreceptor cells and in some inner retinal neurons. A diurnal rhythm in the dark-adapted ERG responses was observed in WT mice, with higher a- and b-wave amplitudes at night, but this rhythm was absent in mice lacking MT1 receptors. Injection of melatonin during the day decreased the scotopic response threshold and the amplitude of the a- and b-waves in the WT mice, but not in the MT1(-/-) mice. The effects of MT1 receptor deficiency on retinal morphology was investigated at three different ages (3, 12, and 18 months). No differences between MT1(-/-) and WT mice were observed at 3 months of age, whereas at 12 months MT1(-/-) mice have a significant reduction in the number of photoreceptor nuclei in the outer nuclear layer compared with WT controls. No differences were observed in the number of cells in inner nuclear layer or in ganglion cells at 12 months of age. At 18 months, the loss of photoreceptor nuclei in the outer nuclear layer was further accentuated and the number of ganglion cells was also significantly lower than that of controls. These data demonstrate the functional significance of melatonin and MT1 receptors in the mammalian retina and create the basis for future studies on the therapeutic use of melatonin in retinal degeneration.


Conflict of interest statement

The authors declare no conflict of interest.

Figures

Fig. 1.
Fig. 1.
Localization of MT1 transcripts in the retina determined by in situ hybridization using a fluorescein-labeled probe. (A) The antisense probe detected a clear signal in the outer nuclear layer (ONL) and inner retinal layer (INL); a faint signal was also present in some ganglion cells (GCL, arrows). (B) No signal was detected using the sense probe. (C) Laser capture microdissection (LCM) of individual cell layers from the mouse retina. (D) RT-PCR generated amplicons of MT1 receptor mRNA in the outer nuclear layer (ONL), in the inner nuclear layer (INL), and in the ganglion cell layer (GCL) collected with LCM. The RT-PCR products had the predicted size (150 bp).
Fig. 2.
Fig. 2.
Representative trace of dark-adapted ERG in C3H/f+/+ (Left) and C3H/f+/+MT1−/− (Right) at the seven different luminance levels recorded at night (ZT18). A clear reduction in the amplitude of the a- and b-waves is present in C3H/f+/+MT1−/−.
Fig. 3.
Fig. 3.
Quantification of dark-adapted ERG responses to flashes of light recorded in the middle of the day (ZT6) and in the middle of the night (ZT18). Mice (3–4 months old) were dark-adapted for at least 30 min before the recordings were performed. Data are presented as mean ± SEM; n = 4–6 for each time point and genotype. Two-way ANOVA indicated a statistically significant contribution of the time of day for the a-wave (P < 0.05) and b-wave (P < 0.001) amplitudes and for genotype (P < 0.005, a-wave; P < 0.001, b-wave). The implicit time of the a-wave and b-wave was also affected by the time of the day (P < 0.001 in both cases), but not by the genotype (P > 0.1 and P > 0.1, respectively).
Fig. 4.
Fig. 4.
Quantification of dark-adapted ERG responses to flashes (0.11–5.85 cd*s/m2) of light recorded after 1 h of dark adaptation and i.p. injection of melatonin (1 mg/kg) or vehicle in the middle of the day (ZT6). Data are presented as mean ± SEM; n = 4–6 for each time point and genotype. In C3H/f+/+ mice melatonin injection induced a significant increase in the amplitude of the a-wave and b-wave (two-way ANOVA, P < 0.001 in both cases). In C3H/f+/+MT1−/− mice melatonin injection did not affect the amplitude of the a-wave or b-wave (two-way ANOVA, P > 0.1, a-wave; and P > 0.1, b-wave). Mice were 3–4 months old at the time of the experiment.
Fig. 5.
Fig. 5.
Representative traces of responses in 3- to 4-month-old C3H/f+/+ mice injected with melatonin or vehicle (Left). Quantification of the dark-adapted response of the b-wave to flashes of light (−6.6 to −1.6 log cd*s/m2; 0.11 5 cd*s/m2) recorded after 1 h of dark adaptation and intraperitoneal injection of melatonin (1 mg/kg) or vehicle in the middle of the day (Right). Data are presented as mean ± SEM; n = 5–8 for each time point and genotype. In C3H/f+/+ mice, melatonin injection induced a significant reduction in the scotopic threshold response and increased the amplitude of the b-wave (two-way ANOVA, P < 0.001). In C3H/f+/+MT1−/− mice, melatonin injection did not affect the scotopic threshold response or the amplitude of the b-wave (two-way ANOVA, P > 0.1).
Fig. 6.
Fig. 6.
Quantification of light-adapted ERG responses to flashes of light recorded after 1 h of dark adaptation and i.p. injection of melatonin (1 mg/kg) in the middle of the day (ZT6). Data are presented as mean ± SEM; n = 4–8 for each time point and genotype. In C3H/f+/+ mice (A and B) melatonin injection induced a significant increase in the amplitude of the b-wave (two-way ANOVA, P < 0.001 in both cases) and a reduction in the implicit time (two-way ANOVA, P < 0.05). In C3H/f+/+MT1−/− mice (C and D) melatonin injection did not affect the amplitude of the b-wave or the implicit time (two-way ANOVA, P > 0.1, b-wave; P > 0.1, implicit time). Mice were 3–4 months old at the time of the experiment.
Fig. 7.
Fig. 7.
Immunofluorescence staining of vertical retinal sections from C3H/f+/+MT1−/− mice at 3 months, showing a normal complement of cell types and retinal lamination. (A) TOTO-3 nuclear staining (blue) shows normal retinal layering. mGluR6 (red) and PSD95 (green-yellow) are normally distributed in the outer plexiform layer (opl), as also shown at higher magnification (Inset). (B) Recoverin staining (red) of photoreceptor (Ph) outer segments and cell bodies. Bassoon staining (green) shows the characteristic pattern of semicircular, punctate structures in the opl, associated to photoreceptor synaptic ribbons. (C) Protein kinase Cα antibodies (red) show rod bipolar cells (RB) with a normal complement of kinesin II-positive puncta (green) decorating their dendritic tips. (D) RB cells (labeled red by PKCα antibodies are postsynaptic to rod spherules, labeled green by PSD95. (E) Antibody against S-cone opsin (red) reveals a normal pattern of cones (dorsal retinal quadrant); Goα (green) shows the morphology of ON-bipolar cells, including cone bipolars (CB). (F) Calbindin staining (red) of horizontal cells (HCs). A normal complement of amacrine cells (AC) are also more weakly stained. PSD95-positive photoreceptor terminals in the opl (green) are appropriately apposed to horizontal cell dendrites. (G) Calbindin staining of HC cell bodies (red) combined with associated to neurofilament staining of their axonal arborizations (green). Neurofilament labels ganglion cells in their entirety. One large-size ganglion cell is indicated (GC). (H) Calbindin staining (red) associated to bassoon show that dendrites of HCs are appropriately decorated by ribbons at their presynaptic sites in the opl. Some dendritic sprouting, also observed in the C3H/f+/+ retina, is visible in the opl. (I) Antibodies against tyrosine hydroxylase show a population of dopaminergic amacrine cells (TH-ACs). Their typical pattern of stratification, mostly visible in sublamina 1 of the ipl and in the opl, is indistinguishable from the C3H/f+/+ counterpart. Synaptophysin vesicle staining (green) shows a normal distribution in photoreceptor terminals in the opl and throughout the ipl, as expected. (Scale bars, 20 μm.)
Fig. 8.
Fig. 8.
Photomicrographs of retinas from C3H/f+/+MT1−/− mice. Mice were 3 (A), 12 (B), and 18 (C) months of age. (Scale bars, 50 μm.)
Fig. 9.
Fig. 9.
Morphometric analysis of retinas of C3H/f+/+ (white bars) and C3H/f+/+MT1−/− (black bars) at the three different ages. In panels A–D are shown the results obtained by measuring the length of the rod outer segment (OS) and inner segment (IS), counting the total number of photoreceptor nuclei (ONL) and ganglion cells in the central superior retina. A significant change in the length of the OS, IS, and in the number of cells in the ONL and GCL is present between C3H/f+/+ and C3H/f+/+MT1−/− at 18 months of age. In both genotypes, the number of cells in the ONL showed a significant reduction with aging (two-way ANOVA, P < 0.05). Each bar, the mean ± SEM; n = 4–6. *, P < 0.05 (Holm-Sidak test).

References

    1. Dubocovich ML, Markowska M. Functional MT1 and MT2 melatonin receptors in mammals. Endocrine. 2005;27:101–110. - PubMed
    1. Cahill GM, Besharse JC. Circadian clock functions localized in Xenopus retinal photoreceptors. Neuron. 1993;10:573–577. - PubMed
    1. Liu C, Fukuhara C, Wessel JH, Iuvone PM, Tosini G. Localization of Aa-nat mRNA in the rat retina by fluorescence in situ hybridization and laser capture microdissection. Cell Tissue Res. 2004;315:197–201. - PubMed
    1. Ivanova TN, Iuvone PM. Circadian rhythm and photic control of cAMP level in chick retinal cell cultures: A mechanism for coupling the circadian oscillator to the melatonin-synthesizing enzyme, arylalkylamine N-acetyltransferase, in photoreceptor cells. Brain Res. 2003;991:96–100. - PubMed
    1. Tosini G, Davidson AJ, Fukuhara C, Kasamatsu M, Castanon-Cervantes O. Localization of a circadian clock in mammalian photoreceptors. FASEB J. 2007;21:3866–3871. - PMC - PubMed

Publication types