. 2009 Sep 1;106(35):15025-30.
doi: 10.1073/pnas.0907084106. Epub 2009 Aug 14.

Two-photon excitation of channelrhodopsin-2 at saturation

Affiliations

Two-photon excitation of channelrhodopsin-2 at saturation

John Peter Rickgauer et al. Proc Natl Acad Sci U S A. .

Abstract

We demonstrate that channelrhodopsin-2 (CR), a light-gated ion channel that is conventionally activated by using visible-light excitation, can also be activated by using IR two-photon excitation (TPE). An empirical estimate of CR's two-photon absorption cross-section at lambda = 920 nm is presented, with a value (260 +/- 20 GM) indicating that TPE stimulation of CR photocurrents is not typically limited by intrinsic molecular excitability [1 GM = 10(-50)(cm4 s)/photon]. By using direct physiological measurements of CR photocurrents and a model of ground-state depletion, we evaluate how saturation of CR's current-conducting state influences the spatial resolution of focused TPE photostimulation, and how photocurrents stimulated by using low-power scanning TPE temporally summate. We show that TPE, like visible-light excitation, can be used to stimulate action potentials in cultured CR-expressing neurons.


Conflict of interest statement

The authors declare no conflict of interest.

Figures

Fig. 1.
Fig. 1.
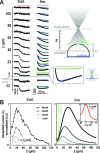
Estimating σ2 with measurements of saturation-limited excitation. (A) CR photocurrents stimulated experimentally by using wide-field blue-light illumination (λ = 470 ± 13 nm; blue traces, above) or IR TPE focused to a large-diameter spot (λ = 920 ± 6 nm; red traces, below); experimental illumination geometries are depicted at right (ωtp = 35 μm). Overline indicates illumination epoch (500 ms); trace shading denotes incident intensities (I) or peak squared intensities (I2; see SI Appendix). Each trace is the average of 5–10 repeat trials. (Inset, Lower) Photocurrents excited by using mode-locked (ML) and non-mode-locked (no ML) pulses at constant average power; scale bars are 40 pA, 32 ms. Traces are five-trial averages. (B) Numerically simulated transient photocurrents, generated by using Eq. 5 for each indicated value of σ12, lower traces), I values from A (I2, lower), and t = 0 − 10 ms (0 − 25 ms, lower). Amplitudes in each frame are scaled to maximum values reached during the interval (maximum values are indicated below). (C) Experimental currents from A with overlaid fits to Eq. 5. Boxed values of σ12, lower) were obtained by fitting the family of traces simultaneously to Eq. 5, and then used to generate the overlaid fits.
Fig. 2.
Fig. 2.
Out-of-focus excitation of CR photocurrents at saturation. (A) Photocurrents stimulated by using a stationary TPE focus (N.A. = 0.8, 40 mW average power; red overline indicates stimulated epoch), with the plane of focus separated by a distance z from the plane through the cell equator (a schematic illustration of this geometry is shown at right), as measured experimentally (Left column) and simulated numerically (Right column). At each z value, simulated currents shown in green and blue represent Eq. 6 evaluated at surface 1 and surface 2, respectively, and the black trace represents the summed current (1 + 2). Simulations used h = 10 μm, σ2 = 250 GM, and current time constants τ1 = 1 ms and τ2 = 20 ms. (B) Total charge, QT (membrane current integrated from t = 0 to t = 15 ms) plotted against z as defined above, as measured (Left) and simulated (Right) at the indicated sample-plane powers; all values in each frame are scaled to a single common value). Green line in simulation frame indicates the location of surface 1, as represented in A. (Inset) Same as other simulations, but using 0.1 mW average power and scaled for visibility.
Fig. 3.
Fig. 3.
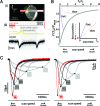
Photocurrents stimulated by focused TPE. (A) Strip scan. (i) TPLSM fluorescence image of a CR-expressing cell (gray = volume-filling Alexa 594, projected in z; yellow = CR-EYFP, single z-focal plane). Highlighted region indicates the boundary of a strip-scan stimulation trajectory (schematically represented in red), in which the TPE focus was oscillated at 1 kHz (y) while scanning across the cell (x). (ii) TPE-stimulated photocurrent recorded during a strip-scan (gray = 5 repeats overlaid; black = average), and trial-averaged TPE fluorescence recording during strip scans (yellow = CR-EYFP; dye-filled region indicates thresholded intracellular Alexa 594 fluorescence). Horizontal axis denotes scan time (0–1024 ms; scan distance is 57 μm). (B) Temporal summation of photocurrents stimulated by a moving TPE focus: maximum photocurrents (scaled) predicted for CR molecules excited in a temporal sequence, occurring over a total time of Ts, approximating progressive excitation by a moving focal spot (Eq. 7). (Inset) Schematic representation of fast and slow scans over a fixed number of molecules. (C) Photocurrents stimulated by focused TPE scans [N.A. = 0.2; I02 = 3.8 × 1054γ2/cm4 s2, (Left); 2.5 × 1054γ2/cm4 s2, (Right)], illustrating the effect of scan consolidation (i.e., reducing total scan time, Ts). Peak currents are indicated and connected by dotted lines. Raster scan times (grayscale; shorter = faster = left) were varied by changing the number of lines in a fixed-area raster. Currents stimulated using spiral-scan trajectories, scanning inward from the cell boundary to the center, are shown in red [Ts = 27 ms, (Left); Ts = 16 ms, (Right)]. Traces are registered in time by the measured onset of fluorescence during each scan, and represent average response from three or more trials.
Fig. 4.
Fig. 4.
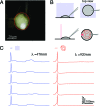
Stimulation of action potentials using TPE. (A) TPE fluorescence image of a patch-clamped SCG neuron in culture (CR-EYFP, yellow; volume-filling Alexa 594, gray). Red outline indicates the outer boundary used to designate a spiral-scan trajectory. (B) Schematic depiction of geometries of whole-cell blue-light excitation (Upper) and scanning TPE stimulation (Lower), shown in side view and from the top. (C) Current-clamp recordings of membrane voltage changes, stimulated by using wide-field blue-light illumination (I = 1019γ/cm2 s; Left) or 32 ms spiral scans with TPE (N.A. = 0.3, I02 = 7.9 × 1054γ2/cm4 s2; Right). Overlines indicate stimulation times.

References

    1. Nagel G, et al. Channelrhodopsin-2, a directly light-gated cation-selective membrane channel. Proc Natl Acad Sci USA. 2003;100:13940–13945. - PMC - PubMed
    1. Boyden ES, Zhang F, Bamberg E, Nagel G, Deisseroth K. Millisecond-timescale, genetically targeted optical control of neural activity. Nat Neurosci. 2005;8:1263–1268. - PubMed
    1. Berndt A, Yizhar O, Gunaydin LA, Hegemann P, Deisseroth K. Bi-stable neural state switches. Nat Neurosci. 2009;12:229–234. - PubMed
    1. Lin JY, Lin MZ, Steinbach P, Tsien RY. Characterization of engineered channelrhodopsin variants with improved properties and kinetics. Biophys J. 2009;96:1803–1814. - PMC - PubMed
    1. Huber D, et al. Sparse optical microstimulation in barrel cortex drives learned behaviour in freely moving mice. Nature. 2008;451:61–64. - PMC - PubMed

Publication types

LinkOut - more resources