. 2009 Sep 1;106(35):15031-6.
doi: 10.1073/pnas.0905580106. Epub 2009 Aug 14.

Substantial similarity in amygdala neuronal activity during conditioned appetitive and aversive emotional arousal

Affiliations

Substantial similarity in amygdala neuronal activity during conditioned appetitive and aversive emotional arousal

Steven J Shabel et al. Proc Natl Acad Sci U S A. .

Abstract

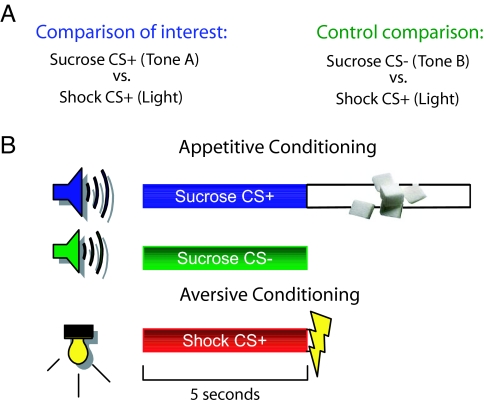
The amygdala is important for determining the emotional significance of environmental stimuli. However, the degree to which appetitive and aversive stimuli are processed by the same or different neuronal circuits within the amygdala remains unclear. Here we show that neuronal activity during the expression of classically conditioned appetitive and aversive emotional responses is more similar than expected by chance, despite the different sensory modalities of the eliciting stimuli. We also found that the activity of a large number of cells (> 43%) was correlated with blood pressure, a measure of emotional arousal. Together, our results suggest that a substantial proportion of neuronal circuits within the amygdala can contribute to both appetitive and aversive emotional arousal.


Conflict of interest statement

The authors declare no conflict of interest.

Figures

Fig. 1.
Fig. 1.
Experimental design and behavioral training. (A) Experimental design. (B) Behavioral training. All conditioned stimuli lasted 5 seconds. Sucrose (0.1 mL of a 5% solution, 5 s) was delivered into the reward port immediately after the termination of the sucrose CS+. Footshock (0.4 mA, 0.5 s) was administered immediately after the termination of the shock CS+.
Fig. 2.
Fig. 2.
Behavior and blood pressure during Pavlovian conditioning. (A–D) Large frames depict mean behavior and blood-pressure responses during the 3 seconds before (bins −2, −1, 0) and 5 seconds after (bins 1–5) conditioned stimulus onset. Insets show the overall mean response during the conditioned stimulus (bins 1–5 together). (A) Rats approached and remained in the port longer during the sucrose CS+ than the sucrose CS−. (B) Larger increases in blood pressure during the sucrose CS+ than the sucrose CS−. (C) Larger increases in blood pressure during aversive conditioning than during habituation. (D) Increase in movement during the end of the shock CS+ during aversive conditioning. Bins 3–5 are significantly different from bin 0. (n = 10 rats). * P < 0.01.
Fig. 3.
Fig. 3.
Neuronal activity during the conditioned stimuli. (A) Percentage of cells with statistically significant changes in activity during the conditioned stimuli (n = 518 cells). There were more cells with responses during the sucrose CS+ and shock CS+ than the sucrose CS−. (B) Mean magnitude change in neuronal activity during the conditioned stimuli. Mean activity of the population changed more during the sucrose CS+ and shock CS+ than during the sucrose CS− (n = 518 cells). Frames and insets as in Fig. 2. * P < 0.0001.
Fig. 4.
Fig. 4.
Categories of neuronal responses to sucrose CS+ and shock CS+. (A) Percentage of total population with a given neuronal response type during the sucrose CS+ and shock CS+ (n = 518 cells). (B and C) Perievent rasters and histograms of a single neuron response to each stimulus. Rasters depict spiking on individual trials; histograms depict mean firing rate across trials. Time on the x axis is relative to stimulus onset (x = 0). Bin = 100 ms. (B) Example of a same cell with increases in activity during the sucrose CS+ and shock CS+. This cell was located in the BLA. (C) Example of a same cell with decreases in activity during the sucrose CS+ and shock CS+. This cell was located in the CeN.
Fig. 5.
Fig. 5.
Neuronal activity during the sucrose CS+ predicts neuronal activity during the shock CS+ and vice versa. (A and B) Amygdala cells (n = 518 cells). (C and D) BLA cells (n = 313 cells). (E and F) CeN cells (n = 178 cells). (A, C, E) Probability of increases in activity. (B, D, F) Probability of decreases in activity. (A) Cells with increases in activity during one CS+ were more likely than the rest of the population to have increases in activity during the other CS+. Cells with decreases in activity during the shock CS+ were less likely than the rest of the population to have increases in activity during the sucrose CS+. (B) Cells with decreases in activity during one CS+ were more likely than the rest of the population to have decreases in activity during the other CS+. Cells with increases in activity during the sucrose CS+ were less likely to have decreases in activity during the shock CS+. (C) Same as A except that, additionally, cells with decreases in activity during the sucrose CS+ were less likely than the rest of the population to have increases in activity during the shock CS+. (D) Same as B except that, additionally, cells with increases in activity during the shock CS+ were less likely than the rest of the population to have decreases in activity during the sucrose CS+. (F) Cells with decreases in activity during one CS+ were more likely than the rest of the population to have decreases in activity during the other CS+. Note that half of the statistical tests depicted here are redundant for each dataset (see SI Materials and Methods) and denoted as such by the same-color asterisk. Also, note the different scales on the x axis for (A, C, E and B, D, F). * P < 0.05, ** P < 0.01, *** P < 0.0001.
Fig. 6.
Fig. 6.
Design of aligned versus shuffled comparisons. If neuronal activity is similar during the conditioned stimuli, then the difference in the aligned condition should be less than the difference in the shuffled condition. If neuronal activity is different during the conditioned stimuli, then the difference in the aligned condition should be greater than the difference in the shuffled condition.
Fig. 7.
Fig. 7.
Comparisons of neuronal activity during the conditioned stimuli across all recorded cells. (A and B) All amygdala cells (n = 518 cells). (C and D) BLA cells (n = 313 cells). (E and F) CeN cells (n = 178 cells). (A, C, E) Comparisons of neuronal activity during the sucrose CS+ and shock CS+. The mean differences in the aligned condition are less than the mean differences in the shuffled condition. (B, D, F) Comparisons of neuronal activity during the sucrose CS− and shock CS+. No significant differences between aligned and shuffled conditions. Large frames and insets as in Fig. 2. * P < 0.05, ** P < 0.0001.

References

    1. Phelps EA, LeDoux JE. Contributions of the amygdala to emotion processing: From animal models to human behavior. Neuron. 2005;48:175–187. - PubMed
    1. Gallagher M, Chiba AA. The amygdala and emotion. Curr Opin Neurobiol. 1996;6:221–227. - PubMed
    1. Zald DH. The human amygdala and the emotional evaluation of sensory stimuli. Brain Res Brain Res Rev. 2003;41:88–123. - PubMed
    1. Davis M, Whalen PJ. The amygdala: Vigilance and emotion. Mol Psychiatry. 2001;6:13–34. - PubMed
    1. McGaugh JL. The amygdala modulates the consolidation of memories of emotionally arousing experiences. Annu Rev Neurosci. 2004;27:1–28. - PubMed

Publication types

LinkOut - more resources