. 2009 Sep 1;106(35):15049-54.
doi: 10.1073/pnas.0907660106. Epub 2009 Aug 14.

Sparsification of neuronal activity in the visual cortex at eye-opening

Affiliations

Sparsification of neuronal activity in the visual cortex at eye-opening

Nathalie L Rochefort et al. Proc Natl Acad Sci U S A. .

Abstract

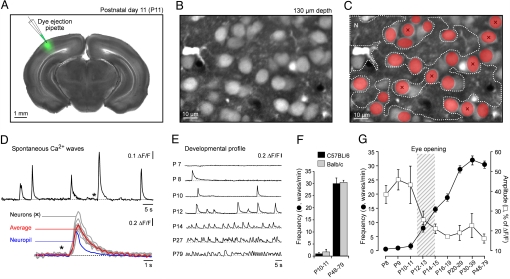
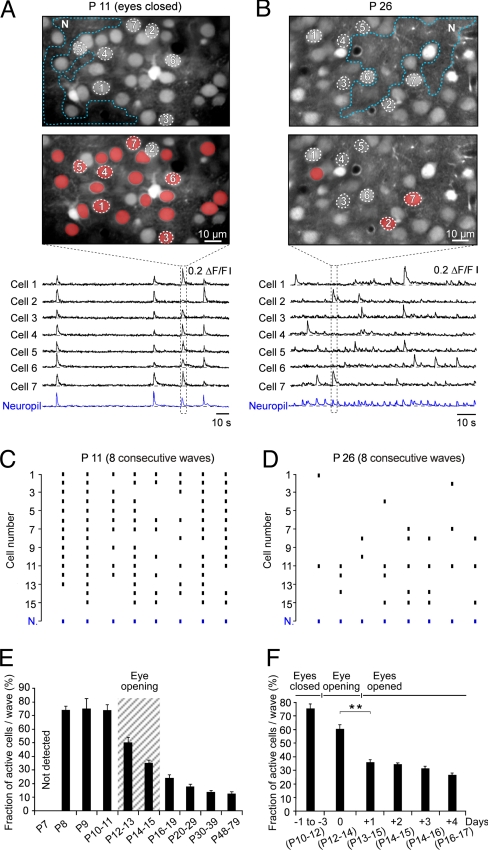
Eye-opening represents a turning point in the function of the visual cortex. Before eye-opening, the visual cortex is largely devoid of sensory inputs and neuronal activities are generated intrinsically. After eye-opening, the cortex starts to integrate visual information. Here we used in vivo two-photon calcium imaging to explore the developmental changes of the mouse visual cortex by analyzing the ongoing spontaneous activity. We found that before eye-opening, the activity of layer 2/3 neurons consists predominantly of slow wave oscillations. These waves were first detected at postnatal day 8 (P8). Their initial very low frequency (0.01 Hz) gradually increased during development to approximately 0.5 Hz in adults. Before eye-opening, a large fraction of neurons (>75%) was active during each wave. One day after eye-opening, this dense mode of recruitment changed to a sparse mode with only 36% of active neurons per wave. This was followed by a progressive decrease during the following weeks, reaching 12% of active neurons per wave in adults. The possible role of visual experience for this process of sparsification was investigated by analyzing dark-reared mice. We found that sparsification also occurred in these mice, but that the switch from a dense to a sparse activity pattern was delayed by 3-4 days as compared with normally-reared mice. These results reveal a modulatory contribution of visual experience during the first days after eye-opening, but an overall dominating role of intrinsic factors. We propose that the transformation in network activity from dense to sparse is a prerequisite for the changed cortical function at eye-opening.


Conflict of interest statement

The authors declare no conflict of interest.

Figures

Fig. 1.
Fig. 1.
Spontaneous Ca2+ waves in the developing mouse visual cortex in vivo. (A) Combined fluorescence/transmitted light micrograph of a coronal brain slice from an 11-day-old C57BL/6 mouse taken after an in vivo experiment. The area stained in vivo with OGB-1 is shown in green. (B) An in vivo micrograph showing an area of layer 2/3 in the primary visual cortex where recordings illustrated in D were made. (C) Active cells (in red) during a representative Ca2+ wave at P11. (D) Upper: spontaneous Ca2+ waves, recorded from a region of interest covering the entire frame shown in B and C. Lower: cellular responses during the Ca2+ wave marked with an asterisk in the upper trace, in seven neurons (x) and in the neuropil (N) (regions of interest are indicated in C). The Average trace (red) is the mean of the seven neuronal responses. (E) Developmental profile of the spontaneous Ca2+ waves. Each trace is a recording from a large region of interest (e.g. D, upper trace), at different ages. (F) Frequencies of spontaneous Ca2+ waves in C57BL/6 and BALB/c mice before eye-opening (P10–11) and 6 weeks after eye-opening (P48–79), (C57BL/6 mice: 10 animals/P10–11, 5/P48–P79; BALB/c mice: 9/P10–11, 5/P48–P79). (G) Frequencies (filled circles) and amplitudes (open squares) of spontaneous Ca2+ waves at different ages. Data from C57BL/6 and BALB/c mice were pooled, because for each age-group there was no significant difference (Student's t test) between both strains (BALB/c mice: 5 animals/P8, 5/P9, 4/P10, 5/P11, 5/P12–P13, 5/P14–P15, 4/P16–P19, 5/P20–29, 4/P30–P39, 5/P48–P79; C57BL/6 mice: 5/P8–P9, 5/P10, 5/P11, 13/P12–P13, 13/P14–P15, 5/P16–P19, 10/P20–29, 5/P30–P39, 5/P48–P79). Here and below error bars represent standard error of the mean.
Fig. 2.
Fig. 2.
Cellular properties of neuronal Ca2+ signals during slow wave activity. (A and B) Simultaneous recordings of spontaneous Ca2+ transients and underlying action potential firing in loose-seal cell-attached configuration (B) in a layer 2/3 neuron (A) in the primary visual cortex of a C57BL/6 15-day-old mouse. Spontaneously occurring action potentials (APs) are indicated in red. (C) Relation between the number of action potentials and the amplitude (ΔF/F) of the corresponding Ca2+ transient (P14-P16 C57BL/6 mice, seven cells as indicated). Dotted line indicates the linear least squares fit to the data. (D) Box-and-whisker plot (Left) and cumulative functions (Right) illustrating the distribution of number of action potentials per calcium transient at P11–P12 (5 cells) and P14–P16 (12 cells). The median number of action potentials per Ca2+ transient at P11–P12, before eye-opening, was significantly higher (Kolmogorov-Smirnov test, Z = 5.331, P < 0.001) than that at P14–P16, after eye-opening. (E) Simultaneous whole-cell patch-clamp recordings of electrical activity (Top) from a layer 2/3 cell within the field of view and Ca2+ recordings from the surrounding neuropil (Lower). Note that the Up-Down states are strictly associated with the Ca2+ wave activity in the neuropil. Mouse age was P17. (F) Histogram of the membrane potential values of the same neuron as in E.
Fig. 3.
Fig. 3.
Sparsification of spontaneous neuronal activity after eye-opening. (A and B) Recordings from layer 2/3 in the visual cortex of a P11 (A) and a P26 C57BL/6 mouse (B). The two images in the top row indicate the regions of interest. The two images in the middle row display active cells (in red) during a representative Ca2+ wave (dotted lines) at P11 and P26, respectively. Bottom row: wave-associated Ca2+ transients in individual neurons. Note the pronounced increase in the frequency of neuropil wave activity at P26. (C and D) Dot plot representation of cellular responses during eight consecutive Ca2+ waves at P11 and P26, respectively (same experiments as those shown in A and B). (E) Fraction of cells active during a given Ca2+ wave as a function of postnatal age. Data obtained from both C57BL/6 and BALB/c mice were pooled, because for each age-group there was no significant difference (Student's t test) between both strains (same experiments as those shown in Fig. 1G). (F) Fraction of active cells per Ca2+ wave in relation to the day of eye-opening. The day of eye-opening (P12–14) is indicated in the graph as day 0. All results were obtained in C57BL/6 mice [eyes closed (-1 to −3); 6 animals; day of eye-opening: 6 animals; eyes opened (+1 through + 4 days): 6, 5, 4, and 4 animals, respectively). The corresponding postnatal ages of the animals are indicated for each group in parenthesis. The asterisks indicate significance (Kolmogorov-Smirnov test, P < 0.005).
Fig. 4.
Fig. 4.
Sparsification is modulated by visual experience. (A and B) Wave-associated Ca2+ transients in individual layer 2/3 neurons in a control (A) and in a dark-reared (B) 15-day-old mouse, 3 days after eye-opening. The two images in the top row indicate the regions of interest. Bottom row: wave-associated Ca2+ transients in individual neurons. Active cells during a representative Ca2+ wave (indicated by dotted lines in the bottom row) are marked in red. (C and D) Dot plot representation of cellular responses during consecutive waves in a control (C) and in a dark-reared (D) 15-day-old mouse (same experiments as in A and B). (E and F) Fraction of active cells per Ca2+ wave in relation to the day of eye-opening. The day of eye-opening is indicated as day 0, the days before and after eye-opening are indicated by −1 to −3 and by + 1, +2, and so on, respectively. (E) Each circle indicates the percentage obtained in one animal. (F) Mean values of the fraction of active cells per Ca2+ wave in control and dark reared mice. All results were obtained in C57BL/6 mice. Normally reared mice (NR), same number of animals as in Fig. 3E—(F). Dark reared (DR) mice, eyes closed (-1 to −3): 5 animals; day of eye-opening: 5 animals; eyes opened (+1 through + 3 days): 5, 4, and 7 animals, respectively; eyes opened (+4–5 through + 43–75 days): 5, 5, 7, and 10 animals, respectively). The asterisks indicate significance in F (Kolmogorov-Smirnov test, P < 0.01). The corresponding postnatal ages of the animals are indicated for each group in parenthesis.

References

    1. Cang J, et al. Development of precise maps in visual cortex requires patterned spontaneous activity in the retina. Neuron. 2005;48:797–809. - PMC - PubMed
    1. Huberman AD, Feller MB, Chapman B. Mechanisms underlying development of visual maps and receptive fields. Annu Rev Neurosci. 2008;31:479–509. - PMC - PubMed
    1. Lopez-Bendito G, Molnar Z. Thalamocortical development: How are we going to get there? Nat Rev Neurosci. 2003;4:276–289. - PubMed
    1. Hanganu IL, Ben-Ari Y, Khazipov R. Retinal waves trigger spindle bursts in the neonatal rat visual cortex. J Neurosci. 2006;26:6728–6736. - PMC - PubMed
    1. Chiu C, Weliky M. Spontaneous activity in developing ferret visual cortex in vivo. J Neurosci. 2001;21:8906–8914. - PMC - PubMed

Publication types