. 2009 Sep 1;106(35):14908-13.
doi: 10.1073/pnas.0902350106. Epub 2009 Aug 13.

Reconstruction of monocotelydoneous proto-chromosomes reveals faster evolution in plants than in animals

Affiliations

Reconstruction of monocotelydoneous proto-chromosomes reveals faster evolution in plants than in animals

Jérôme Salse et al. Proc Natl Acad Sci U S A. .

Abstract

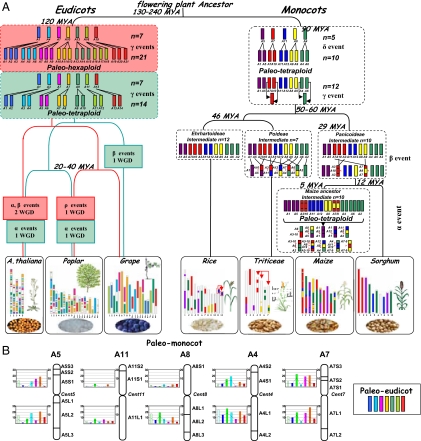
Paleogenomics seeks to reconstruct ancestral genomes from the genes of today's species. The characterization of paleo-duplications represented by 11,737 orthologs and 4,382 paralogs identified in five species belonging to three of the agronomically most important subfamilies of grasses, that is, Ehrhartoideae (rice) Panicoideae (sorghum, maize), and Pooideae (wheat, barley), permitted us to propose a model for an ancestral genome with a minimal size of 33.6 Mb structured in five proto-chromosomes containing at least 9,138 predicted proto-genes. It appears that only four major evolutionary shuffling events (alpha, beta, gamma, and delta) explain the divergence of these five cereal genomes during their evolution from a common paleo-ancestor. Comparative analysis of ancestral gene function with rice as a reference indicated that five categories of genes were preferentially modified during evolution. Furthermore, alignments between the five grass proto-chromosomes and the recently identified seven eudicot proto-chromosomes indicated that additional very active episodes of genome rearrangements and gene mobility occurred during angiosperm evolution. If one compares the pace of primate evolution of 90 million years (233 species) to 60 million years of the Poaceae (10,000 species), change in chromosome structure through speciation has accelerated significantly in plants.


Conflict of interest statement

The authors declare no conflict of interest.

Figures

Fig. 1.
Fig. 1.
Identification of 11,737 orthologs and 4,382 paralogs in five cereal genomes. (A) Schematic representation of the 11,737 orthologs identified between the rice chromosomes (r1 to r12) used as a reference, and the barley (b1 to b7), wheat (w1 to w7), sorghum (s1 to s10), and maize (m1 to m10) chromosomes. Each line represents an orthologous gene. The five different colors used to represent the blocks reflect the origin from the five ancestral proto-chromosomes (15). (B) Schematic representation of the 4,382 paralogous pairs identified within the rice (r1 to r12), barley (b1 to b7), wheat (w1 to w7), sorghum (s1 to s10), and maize (m1 to m10) genomes. Each line represents a duplicated gene. The different colors reflect the origin from the five ancestral proto-chromosomes. Black lines represent lineage specific duplicated paralogs. (C) Distribution of the average CIP/CALP values observed for the orthologous (colored bars) and paralogous (colored curves) genes in the five cereal genomes. The number of genes in each category (paralogous vs. orthologous) is displayed within five classes (from 70 to 100%) of average CIP/CALP values. The asterisks indicate lineage specific events that affect the distribution, that is, the w1-w5-w7 translocation in wheat, the recent r11-r12 duplication in rice and the tetraploidisation (WGD) in maize. A time scale is provided on the left side of the diagram.
Fig. 2.
Fig. 2.
Cereal ancestor proto-chromosomes structure. The synteny between rice (r), considered as the reference sequence (vertical), and maize (m) or sorghum (s) (horizontal) is shown as 12 dot-plots. The rice/sorghum synteny is depicted with 12 red dot-plots. The synteny between rice and maize is displayed as 12 blue and green dot-plots (reflecting the tetraploid nature of the maize genome). The seven paleo-duplications are indicated by gray blocks within the dot plots. Twenty-two ancestral proto-chromosome blocks (from A5S3 to A7L2) were identified with respect to paleo-duplication boundaries shown with gray blocks on A5, A11, A8, A4, and A7, harboring different colored blocks and reflecting the origin from the five ancestral proto-chromosomes. The number of conserved genes (cumulative diagonal dot-plots) and the physical size (cumulative coding sequence length) of each proto-chromosome block is shown in parenthesis on the right end side of the figure.
Fig. 3.
Fig. 3.
Angiosperm evolutionary models. (A) Schematic representation of the monocot (Right) and eudicot (Left) evolutionary scenarios. The monocot chromosomes are represented with a five-color code to illuminate the evolution of segments from a common ancestor with five proto-chromosomes (named according to the rice nomenclature). The four shuffling events that have shaped the structure of the different grass genomes during their evolution from the common ancestor are indicated as δ (whole genome duplication), γ (ancestral chromosome translocations and fusions), β (family specific shuffling), and α (lineage specific shuffling). The seven eudicots proto-chromosomes are represented with different colors. The two scenarios proposed by Jaillon et al. (10) and Velasco et al. (11) are shown in red and green boxes, respectively. The different shuffling events that have shaped the structure of the A. thaliana, poplar and grape genomes during their evolution from a common ancestor are indicated as γ (WGD), β, and α; the cereal ancestor intermediate or lineage-specific shuffling events depend on the model. The current structure of the genomes with the representation of the remaining ancestral duplicated blocks is represented at the bottom. (B) Monocot/Eudicot ancestral genomes comparison. The five monocot proto-chromosomes (with the associated 22 chromosome blocks) are depicted as vertical bars. The number (bars) and origin (seven colors) of orthologs identified between the 9,138 monocot and 9,731 eudicot genes is indicated for each of the 10 monocot proto-chromosome arms.

References

    1. Green RE, et al. A complete Neandertal mitochondrial genome sequence determined by high-throughput sequencing. Cell. 2008;134:416–426. - PMC - PubMed
    1. Bottjer DJ, et al. Paleogenomics of echinoderms. Science. 2006;314:956–960. - PubMed
    1. Poinar HN, et al. Metagenomics to paleogenomics: Large-scale sequencing of mammoth DNA. Science. 2006;311:392–394. - PubMed
    1. Jackson DJ, et al. Sponge paleogenomics reveals an ancient role for carbonic anhydrase in skeletogenesis. Science. 2007;316:1893–1895. - PubMed
    1. Rensing SA, et al. The Physcomitrella genome reveals evolutionary insights into the conquest of land by plants. Science. 2008;319:64–69. - PubMed

Publication types

LinkOut - more resources