

Setting cumulative emissions targets to reduce the risk of dangerous climate change
- PMID: 19706489
- PMCID: PMC2752604
- DOI: 10.1073/pnas.0805800106
Setting cumulative emissions targets to reduce the risk of dangerous climate change
Abstract
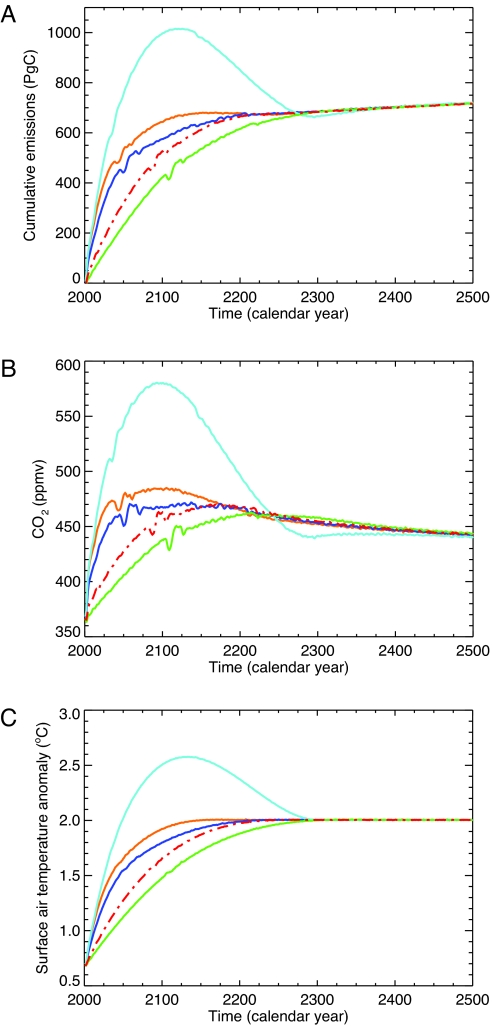
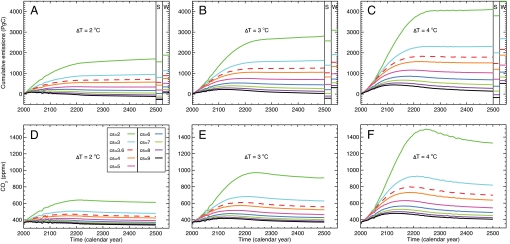
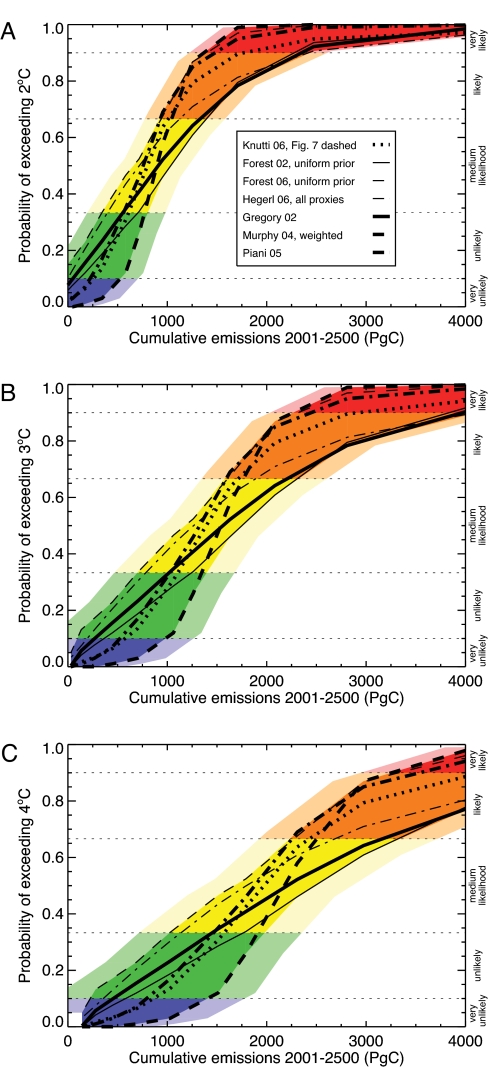
Avoiding "dangerous anthropogenic interference with the climate system" requires stabilization of atmospheric greenhouse gas concentrations and substantial reductions in anthropogenic emissions. Here, we present an inverse approach to coupled climate-carbon cycle modeling, which allows us to estimate the probability that any given level of carbon dioxide (CO2) emissions will exceed specified long-term global mean temperature targets for "dangerous anthropogenic interference," taking into consideration uncertainties in climate sensitivity and the carbon cycle response to climate change. We show that to stabilize global mean temperature increase at 2 degrees C above preindustrial levels with a probability of at least 0.66, cumulative CO2 emissions from 2000 to 2500 must not exceed a median estimate of 590 petagrams of carbon (PgC) (range, 200 to 950 PgC). If the 2 degrees C temperature stabilization target is to be met with a probability of at least 0.9, median total allowable CO2 emissions are 170 PgC (range, -220 to 700 PgC). Furthermore, these estimates of cumulative CO2 emissions, compatible with a specified temperature stabilization target, are independent of the path taken to stabilization. Our analysis therefore supports an international policy framework aimed at avoiding dangerous anthropogenic interference formulated on the basis of total allowable greenhouse gas emissions.
Conflict of interest statement
The authors declare no conflict of interest.
Figures
Comment in
-
Constraining future greenhouse gas emissions by a cumulative target.Proc Natl Acad Sci U S A. 2009 Sep 29;106(39):16539-40. doi: 10.1073/pnas.0908197106. Epub 2009 Sep 22. Proc Natl Acad Sci U S A. 2009. PMID: 19805332 Free PMC article. No abstract available.
References
-
- Smith J, Schellnhuber HJ, Mirza M. Lines of evidence for vulnerability to climate change: A synthesis. In: McCarthy J, Canziani O, Leary N, Dokken D, White K, editors. Climate Change 2001: Impacts, Adaptation and Vulnerability - Contribution of Working Group II to the Third Assessment Report of the IPCC. Cambridge, UK: Cambridge Univ Press; 2001. pp. 914–967.
-
- Schneider S, et al. Assessing key vulnerabilities and the risk from climate change. In: Parry M, Canziani O, Palutikof J, Van der Linden P, Hanson C, editors. Climate Change 2007: Impacts, Adaptation and Vulnerability. Contribution of Working Group II to the Fourth Assessment Report of the Intergovernmental Panel on Climate Change. Cambridge, UK: Cambridge Univ Press; 2007. pp. 779–810.
-
- European Council Presidency Conclusions. (Brussels) 2005. Available at http://europa.eu.int/rapid/pressReleasesAction.do?reference=DOC/05/1&f.
-
- Commission for European Communities. Limiting Global Climate Change to 2 Degrees Celsius: The Way Ahead for 2020 and Beyond. Brussels: Commission for European Communities; 2007.
-
- Wigley TML. Choosing a stabilization target for CO2. Clim Change. 2004;67:1–11.
Publication types
MeSH terms
Substances
LinkOut - more resources
Full Text Sources
Miscellaneous
