. 2009 Sep 15;106(37):15837-42.
doi: 10.1073/pnas.0903419106. Epub 2009 Aug 17.

Heme oxygenase-1 affords protection against noncerebral forms of severe malaria

Affiliations

Heme oxygenase-1 affords protection against noncerebral forms of severe malaria

Elsa Seixas et al. Proc Natl Acad Sci U S A. .

Abstract

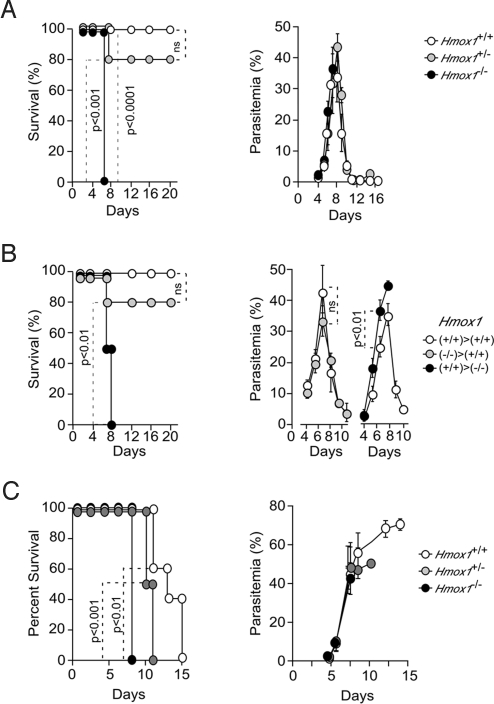
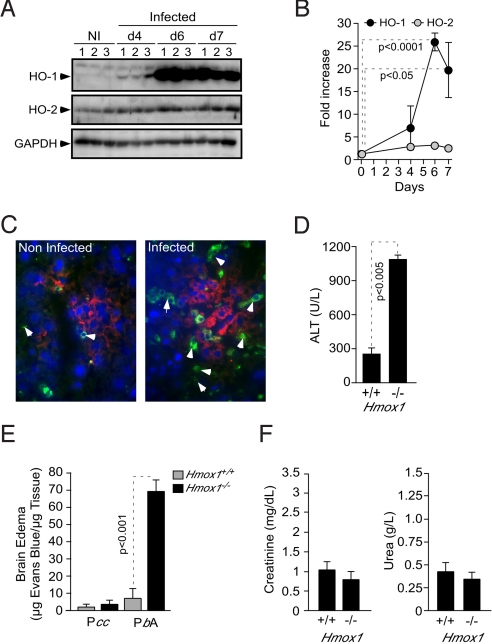
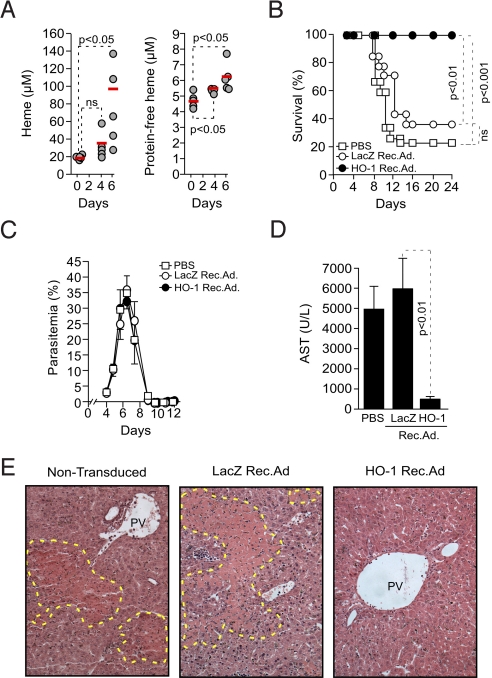
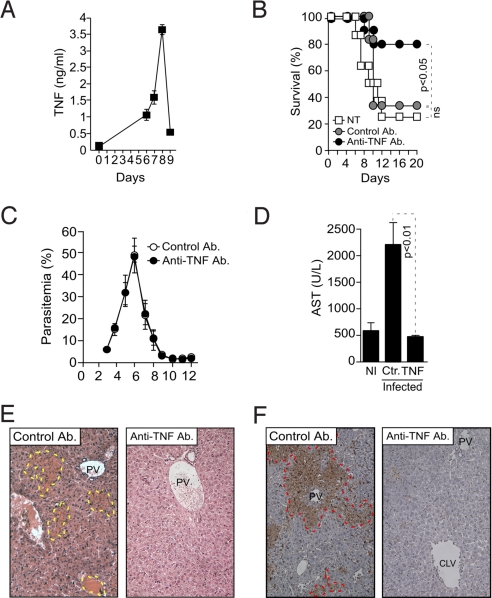
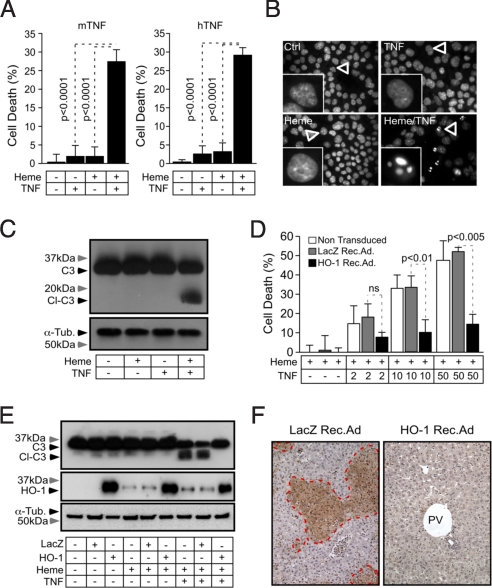
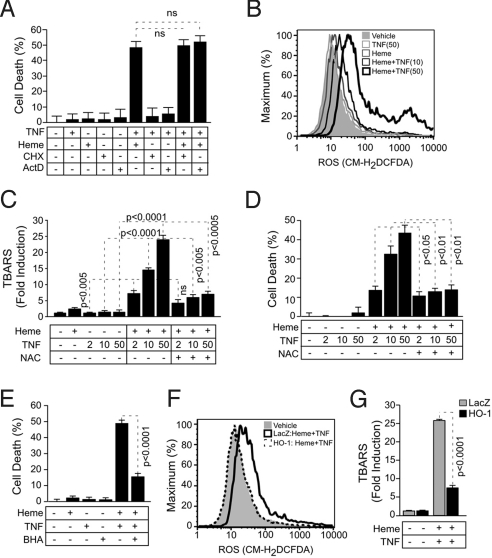
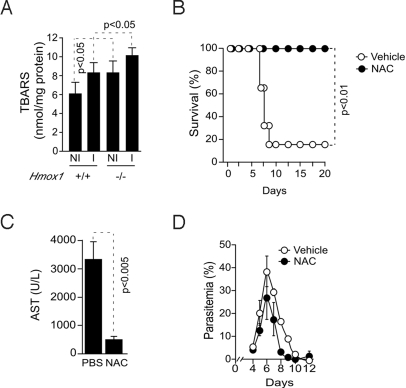
Infection by Plasmodium, the causative agent of malaria, is associated with hemolysis and therefore with release of hemoglobin from RBC. Under inflammatory conditions, cell-free hemoglobin can be oxidized, releasing its heme prosthetic groups and producing deleterious free heme. Here we demonstrate that survival of a Plasmodium-infected host relies strictly on its ability to prevent the cytotoxic effects of free heme via the expression of the heme-catabolyzing enzyme heme oxygenase-1 (HO-1; encoded by the Hmox1 gene). When infected with Plasmodium chabaudi chabaudi (Pcc), wild-type (Hmox1(+/+)) BALB/c mice resolved infection and restored homeostasis thereafter (0% lethality). In contrast, HO-1 deficient (Hmox1(-/-)) BALB/c mice developed a lethal form of hepatic failure (100% lethality), similar to the one occurring in Pcc-infected DBA/2 mice (75% lethality). Expression of HO-1 suppresses the pro-oxidant effects of free heme, preventing it from sensitizing hepatocytes to undergo TNF-mediated programmed cell death by apoptosis. This cytoprotective effect, which inhibits the development of hepatic failure in Pcc-infected mice without interfering with pathogen burden, is mimicked by pharmacological antioxidants such as N-acetylcysteine (NAC). When administered therapeutically, i.e., after Pcc infection, NAC suppressed the development of hepatic failure in Pcc-infected DBA/2 mice (0% lethality), without interfering with pathogen burden. In conclusion, we describe a mechanism of host defense against Plasmodium infection, based on tissue cytoprotection against free heme and limiting disease severity irrespectively of parasite burden.


Conflict of interest statement

The authors declare no conflict of interest.

Figures

Fig. 1.
Fig. 1.
Expression of HO-1 is required to sustain the survival of Pcc-infected mice. (A) Survival and parasitemia of Pcc-infected Hmox1+/+ (n = 8), Hmox1+/− (n = 10), and Hmox1−/− (n = 8) BALB/c mice. (B) Survival and parasitemia of Hmox1+/+Hmox1+/+ (n = 10), Hmox1−/−Hmox1+/+ (n = 5), and Hmox1+/+Hmox1−/− (n = 4) bone marrow chimeric mice. (C) Survival and parasitemia of Pcc-infected Hmox1+/+ (n = 5), Hmox1+/− (n = 6), and Hmox1−/− (n = 6) SCID BALB/c mice. Parasitemias are shown as mean ± SD.
Fig. 2.
Fig. 2.
Induction of HO-1 expression in hepatocytes prevents the development of liver failure in Pcc-infected mice. (A) HO-1, HO-2, and GAPDH proteins were detected by western blot in the livers of noninfected (NI) BALB/c mice or 4, 6, 7 days post-Pcc infection. Numbers (–3) represent individual mice. (B) Liver HO-1 and HO-2 protein expression normalized to GAPDH, 6 days post-Pcc infection, as detected by western blot (n = 3 mice/group). (C) HO-1 (green), F4/80 (red), and DNA (blue) staining in the liver of noninfected or Pcc-infected BALB/c mice, 6 days postinfection. Arrows indicate HO-1 staining in hepatocytes. (D) Mean plasma ALT concentration ± SD, 6 days post-Pcc infection (n = 4 mice/genotype). (E) Brain edema was measured by Evans blue accumulation, 7 days post-Pcc or P. berghei ANKA (PbA) infection in BALB/c mice. (F) Plasma creatinine and urea concentration 6 days post-Pcc infection in BALB/c mice. Results are mean ± SD (n = 3 per group).
Fig. 3.
Fig. 3.
Expression of HO-1 in the liver suppresses liver failure in Pcc-infected mice. (A) Total and protein-free heme in plasma of Pcc-infected DBA/2 mice. Each circle represents an individual mouse. (B) Survival and (C) mean parasitemia ± SD in Pcc-infected DBA/2 mice receiving vehicle (PBS) (n = 12), transduced with HO-1 (n = 12) or LacZ (n = 8) Rec.Ad. (D) Mean plasma AST concentration ± SD, 8 days post-Pcc infection (n = 4 mice/group). (E) Hematoxylin & eosin-stained livers from DBA/2 mice, 7 days post-Pcc infection (200×; representative of eight mice). PV, portal vein. Yellow dotted line surrounds necrosis/apoptosis area.
Fig. 4.
Fig. 4.
Pcc-infected DBA/2 mice succumb to TNF-mediated hepatic failure. (A) Mean plasma TNF concentration ± SD in Pcc-infected DBA/2 mice (n = 5). (B) Percent survival of Pcc-infected DBA/2 mice treated with anti-TNF, isotype-matched control antibody, or not treated (NT) (n = 12 mice per group). (C) Mean parasitemia ± SD in Pcc-infected DBA/2 mice treated with an anti-TNF neutralizing antibody or an isotype-matched control antibody (n = 12 per group). (D) Mean plasma AST concentration ± SD in noninfected (NI; n = 4) and Pcc-infected DBA/2 mice treated with anti-TNF (n = 4) or isotype-matched control antibody (Ab; Ctr; n = 4). (E) Hematoxylin & eosin-stained liver sections, 8 days post-Pcc infection, in DBA/2 mice treated with neutralizing anti-TNF or isotype-matched control antibody (Ab). Images (200×) are representative of eight mice. Doted yellow line surrounds areas of necrosis/apoptosis. (F) Liver section from DBA/2 mice treated as in panel E stained by TUNEL. Dotted red line surrounds areas of necrosis/apoptosis. PV, portal vein; CLV, centrilobular vein. Images (200×) are representative of eight mice.
Fig. 5.
Fig. 5.
Free heme sensitizes hepatocytes to TNF-mediated apoptosis. (A) Mean cytotoxicity of primary mouse hepatocytes exposed to heme (5μΜ for 1 h) plus mouse (m) or human (h) recombinant TNF (5 ng/mL for 16 h) ± SD (n = 6) in one out of three independent experiments. Cytotoxicity was assessed by crystal violet staining. (B) DNA staining (Hoechst 33342) of untreated (Ctrl), heme (40 μM for 1 h), and/or TNF (10 ng/mL for 6 h) treated Hepa1–6 cells (400×). Results are representative of three independent experiments. (C) Caspase-3 (C3), cleaved caspase-3 (Cl-C3), and α-tubulin (α-Tub) were detected by western blot in primary hepatocytes treated as in panel B. Results are representative of two independent experiments. (D) Hepa1–6 cells were transduced or not with HO-1 or LacZ Rec.Ad. and exposed to heme (40 μM for 1 h) alone or heme (40 μM for 1 h) plus TNF (ng/mL for 6 h). Results are expressed as mean ± SD from triplicates in one out of two independent experiments. TNF is expressed in ng/mL. (E) Hepa1–6 cells were treated as in panel D. Caspase-3 (C3), cleaved caspase-3 (Cl-C3), and α-tubulin (α-Tub) were detected by western blot. Results shown are representative of two independent experiments. (F) Liver sections were stained by TUNEL, 8 days post-Pcc infection in DBA/2 mice transduced with HO-1 or control LacZ Rec.Ad. Dotted red lines surround areas of necrosis/apoptosis. PV, portal vein. Images (200×) are representative of eight mice.
Fig. 6.
Fig. 6.
The antioxidant effect of HO-1 suppresses the cytotoxic effect of free heme plus TNF in hepatocytes. (A) Hepa1–6 cells were exposed (+) to heme (40 μM for 1 h) and/or (+) TNF (50 ng/mL for 6 h). When indicated, transcription was inhibited by ActD (5 μg/mL) and translation by CHX (5 μg/mL). Cytotoxicity was assessed by crystal violet staining. Results are expressed as mean ± SD from one out of two independent experiments, each in triplicate. Notice that ActD or CHX did not interfere with the pro-apoptotic effect of heme plus TNF. (B) Free radicals were measured by flow cytometry in Hepa1–6 cells exposed to vehicle, TNF (for 6 h), heme (40 μM for 1 h), or heme (40 μM for 1 h) plus TNF (for 6 h). (C) TBARS in Hepa1–6 cells treated as in panel A are expressed as mean ± SEM obtained from the mean values of three independent experiments, each in duplicate. NAC (10 mM for 4 h before heme and continuously thereafter). (D) Cytotoxicity in Hepa1–6 cells treated with heme plus TNF with or without NAC as in panel C. Results are expressed as mean ± SD from triplicates in one representative experiment out of two independent experiments, each in sixtuplicate. (E) Cytotoxicity in Hepa1–6 cells treated with heme (40 μM or 1 h) plus TNF (50 ng/mL for 6 h) with or without BHA (100 μM for 24 h before heme and continuously thereafter). (F) Free radicals were measured by flow cytometry in Hepa1–6 cells nontransduced (vehicle) or transduced with LacZ or HO-1 Rec.Ad. exposed to heme (40 μM for 1 h) plus TNF (50 ng/mL for 6 h). (G) TBARS in Hepa1–6 cells transduced with LacZ or HO-1 Rec.Ad., treated with heme plus TNF as in panel A, are expressed as mean ± SEM obtained from the mean values of three independent experiments, each in duplicate. TNF is expressed in ng/mL (panels C and D).
Fig. 7.
Fig. 7.
The antioxidant effect of HO-1 suppresses the onset of severe malaria. (A) TBARS in the liver of noninfected (NI) or Pcc-infected (I) wild-type (Hmox1+/+) or HO-1 deficient (Hmox1−/−) BALB/c mice, 5 days post-Pcc infection. Results are expressed as mean ± SD (n = 3 mice/group). (B) Survival of Pcc-infected DBA/2 mice receiving NAC (150 mg/kg) or vehicle (PBS) as control (n = 5–6 mice/group). (C) Mean plasma AST concentration ± SD in Pcc-infected DBA/2 mice receiving NAC (n = 4) or vehicle (PBS) (n = 4). (D) Mean parasitemia ± SD of Pcc-infected DBA/2 mice receiving NAC (n = 5) or vehicle (PBS) (n = 5).

Comment in

  • Damage control in host-pathogen interactions.
    Medzhitov R. Medzhitov R. Proc Natl Acad Sci U S A. 2009 Sep 15;106(37):15525-6. doi: 10.1073/pnas.0908451106. Epub 2009 Sep 9. Proc Natl Acad Sci U S A. 2009. PMID: 19805209 Free PMC article. No abstract available.

References

    1. Snow RW, Guerra CA, Noor AM, Myint HY, Hay SI. The global distribution of clinical episodes of Plasmodium falciparum malaria. Nature. 2005;434:214–217. - PMC - PubMed
    1. Miller LH, Baruch DI, Marsh K, Doumbo OK. The pathogenic basis of malaria. Nature. 2002;415:673–679. - PubMed
    1. Raberg L, Sim D, Read AF. Disentangling genetic variation for resistance and tolerance to infectious diseases in animals. Science. 2007;318:812–814. - PubMed
    1. Schneider DS, Ayres JS. Two ways to survive infection: What resistance and tolerance can teach us about treating infectious diseases. Nat Rev Immunol. 2008;8:889–895. - PMC - PubMed
    1. Ferreira A, Balla J, Jeney V, Balla G, Soares MP. A central role for free heme in the pathogenesis of severe malaria: The missing link? J Mol Med. 2008;86:1097–1111. - PubMed

Publication types

MeSH terms