

Comment
doi: 10.1073/pnas.0906909106.
Epub 2009 Aug 12.
Underestimating malaria risk under variable temperatures
Affiliations
- PMID: 19706496
- PMCID: PMC2728947
- DOI: 10.1073/pnas.0906909106
Item in Clipboard
Comment
Underestimating malaria risk under variable temperatures
Proc Natl Acad Sci U S A.
.
No abstract available
Conflict of interest statement
The authors declare no conflict of interest.
Figures
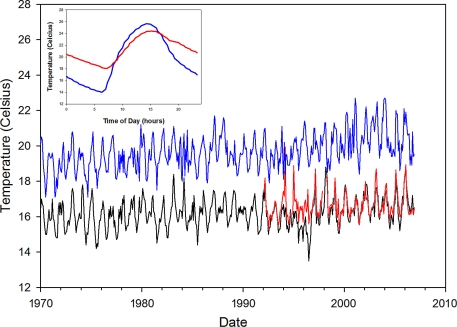
Coupling climate data to malaria population dynamics requires downscaling of climate data that exhibits a variety of spatial and temporal scales (as illustrated here). A global grid product (Climate Research Unit, CRU TS3, www.cru.uea.ac.uk ) averages over an area that is large (0.5° × 0.5°) from an epidemiological perspective. The blue curve shows mean monthly temperatures for the grid point overlapping the tea plantations in Kenya (Kericho district) for which a number of studies have debated the role of temperature on the exacerbation of epidemic malaria. Because of the lower spatial resolution, the CRU data have a higher mean than that of a local meteorological record but a similar trend. Ultimately, temperature limits the altitudinal distribution of malaria in East African highlands, as the parasite is racing against time to develop within the mosquito's lifespan so that it can be transmitted to another human host. Paaijmans et al. (3) show that diurnal variation influences the time it takes for malaria development. For example, when close to the temperature threshold, diurnal variability can give the parasite the edge to persist. The Inset shows the (annual) average diurnal variability in temperature indoors (high wall temperatures, traditional thatch roof, in red), and outdoors (Stevenson's screen, in blue) in an Ethiopian village (≈1950 m, 30-min observations during 1997, J. Cox, A. N. Tulu, and M.J.B., unpublished data). More typically, malaria models have considered mean monthly temperatures; these can exhibit significant interannual (year-to-year) variability as well as long-term trends. Note: In the mid-1980s the official meteorological station in Kericho was relocated to 1977 m, 200 m lower than its original altitude of 2184 m. The original time series is shown in black and compared with the more recent station from 1992 onwards corrected for the change in altitude by using the lapse rate for Kenya (in red). The two local Kericho stations show consistent records for the period of overlap, except for the years between 1994 and 1996, when the higher station exhibits significantly lower values that appear anomalous with the previous patterns of variability and with those of the lower station. These anomalous years may explain why previous analyses of the Tea Research Foundation series up to 1995 failed to detect a trend of ≈1 °C (7).
Comment on
-
Understanding the link between malaria risk and climate.Proc Natl Acad Sci U S A. 2009 Aug 18;106(33):13844-9. doi: 10.1073/pnas.0903423106. Epub 2009 Aug 3. Proc Natl Acad Sci U S A. 2009. PMID: 19666598 Free PMC article.
References
-
- Lafferty KD. The ecology of climate change and infectious diseases. Ecology. 2009;90:888–900. - PubMed
-
- Pascual M, Bouma MJ. Do rising temperatures matter? Ecology. 2009;90:906–912. - PubMed
-
- Heisch RB, Harper JO. An epidemic of malaria in the Kenya highlands transmitted by Anopheles funestus. J Trop Med Hyg. 1949;51:187–190. - PubMed
-
- Bodker R, et al. Relationship between altitude and intensity of malaria transmission in the Usambara mountains, Tanzania. J Med Entomol. 2003;40:706–717. - PubMed
Publication types
MeSH terms
Grants and funding
LinkOut - more resources
Full Text Sources
Medical
