

The epidemiological fitness cost of drug resistance in Mycobacterium tuberculosis
- PMID: 19706556
- PMCID: PMC2732896
- DOI: 10.1073/pnas.0902437106
The epidemiological fitness cost of drug resistance in Mycobacterium tuberculosis
Abstract
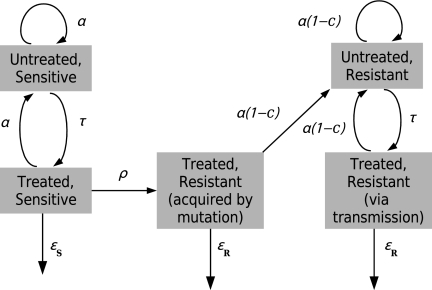
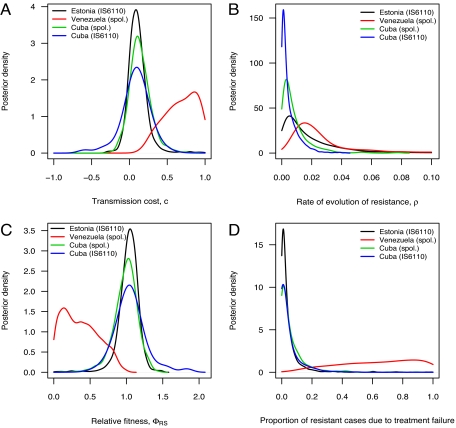
The emergence of antibiotic resistance in Mycobacterium tuberculosis has raised the concern that pathogen strains that are virtually untreatable may become widespread. The acquisition of resistance to antibiotics results in a longer duration of infection in a host, but this resistance may come at a cost through a decreased transmission rate. This raises the question of whether the overall fitness of drug-resistant strains is higher than that of sensitive strains--essential information for predicting the spread of the disease. Here, we directly estimate the transmission cost of drug resistance, the rate at which resistance evolves, and the relative fitness of resistant strains. These estimates are made by using explicit models of the transmission and evolution of sensitive and resistant strains of M. tuberculosis, using approximate Bayesian computation, and molecular epidemiology data from Cuba, Estonia, and Venezuela. We find that the transmission cost of drug resistance relative to sensitivity can be as low as 10%, that resistance evolves at rates of approximately 0.0025-0.02 per case per year, and that the overall fitness of resistant strains is comparable with that of sensitive strains. Furthermore, the contribution of transmission to the spread of drug resistance is very high compared with acquired resistance due to treatment failure (up to 99%). Estimating such parameters directly from in vivo data will be critical to understanding and responding to antibiotic resistance. For instance, projections using our estimates suggest that the prevalence of tuberculosis may decline with successful treatment, but the proportion of cases associated with resistance is likely to increase.
Conflict of interest statement
The authors declare no conflict of interest.
Figures

References
-
- World Health Organization. WHO report 2004. Geneva: WHO; 2004. Anti-tuberculosis drug resistance in the world. Tech Rep (WHO/HTM/TB/2004.343), available at www.who.int/tb/publications/2004/en/index.html.
-
- Cohen J. Infectious disease: Extensively drug-resistant TB gets foothold in South Africa. Science. 2006;313:1554. - PubMed
-
- Cohen T, Sommers B, Murray M. The effect of drug resistance on the fitness of Mycobacterium tuberculosis. Lancet Infect Dis. 2003;3:13–21. - PubMed
-
- Andersson DI, Levin BR. The biological cost of antibiotic resistance. Curr Opin Microbiol. 1999;2:489–493. - PubMed
Publication types
MeSH terms
Substances
LinkOut - more resources
Full Text Sources
Molecular Biology Databases
