An equivalent relative utility metric for evaluating screening mammography
- PMID: 19706880
- PMCID: PMC2812591
- DOI: 10.1177/0272989X09341753
An equivalent relative utility metric for evaluating screening mammography
Abstract
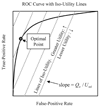
Comparative studies of performance in screening mammography are often ambiguous. A new method will frequently show a higher sensitivity or detection rate than an existing standard with a concomitant increase in false positives or recalls. The authors propose an equivalent relative utility (ERU) metric based on signal detection theory to quantify screening performance in such comparisons. The metric is defined as the relative utility, as defined in classical signal detection theory, needed to make 2 systems equivalent. ERU avoids the problem of requiring a predefined putative relative utility, which has limited application of utility theory in receiver operating characteristic analysis. The metric can be readily estimated from recall and detection rates commonly reported in comparative clinical studies. An important practical advantage of ERU is that in prevalence matched populations, the measure can be estimated without an independent estimate of disease prevalence. Thus estimating ERU does not require a study with long-term follow-up to find cases of missed disease. The approach is applicable to any comparative screening study that reports results in terms of recall and detection rates, although the authors focus exclusively on screening mammography in this work. They derive the ERU from the definition of utility given in classical treatments of signal detection theory. They also investigate reasonable values of relative utility in screening mammography for use in interpreting ERU using data from a large clinical study. As examples of application of ERU, they reanalyze 2 recently published reports using recall and detection rates in screening mammography.
Figures


References
-
- Humphrey LL, Helfand M, Chan BK, Woolf SH. Breast cancer screening: a summary of the evidence for the U.S. Preventive Services Task Force. Ann Intern Med. 2002;137(5 Part 1):347–360. - PubMed
-
- Berry DA, Cronin KA, Plevritis SK, Fryback DG, Clarke L, Zelen M, Mandelblatt JS, et al. Effect of screening and adjuvant therapy on mortality from breast cancer. N Engl J Med. 2005;353(17):1784–1792. - PubMed
-
- Green DM, Swets JA. Signal Detection Theory and Psychophysics. New York: John Wiley & Sons, Inc; 1966.
-
- Swets JA, Pickett RM. Evaluation of Diagnostic Systems: Methods from Signal Detection Theory. New York: Academic; 1982.
Publication types
MeSH terms
Grants and funding
LinkOut - more resources
Full Text Sources
Medical
Research Materials

