. 2009 Sep 8;106(36):15119-24.
doi: 10.1073/pnas.0902778106. Epub 2009 Aug 25.

Characterizing hydrophobicity of interfaces by using cavity formation, solute binding, and water correlations

Affiliations

Characterizing hydrophobicity of interfaces by using cavity formation, solute binding, and water correlations

Rahul Godawat et al. Proc Natl Acad Sci U S A. .

Abstract

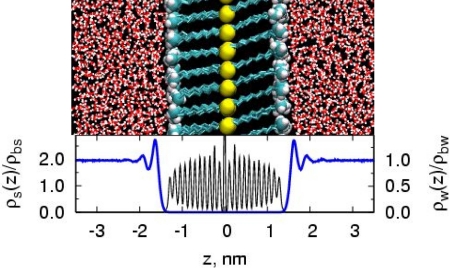
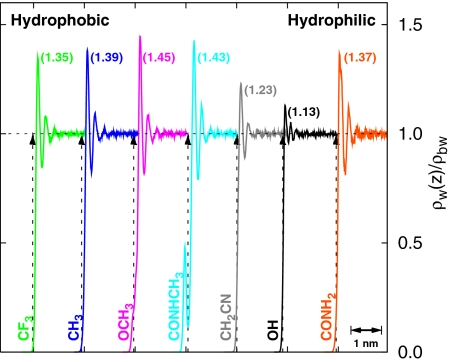
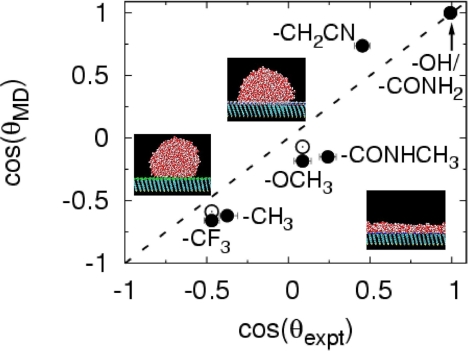
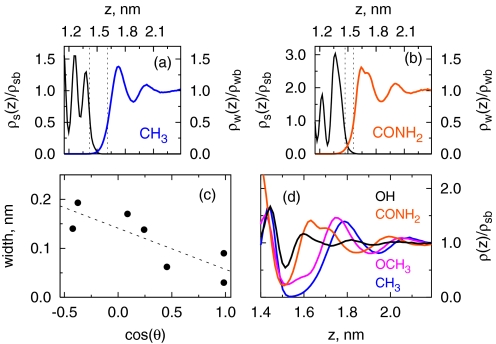
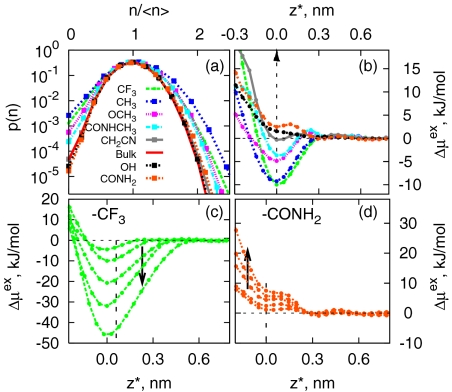
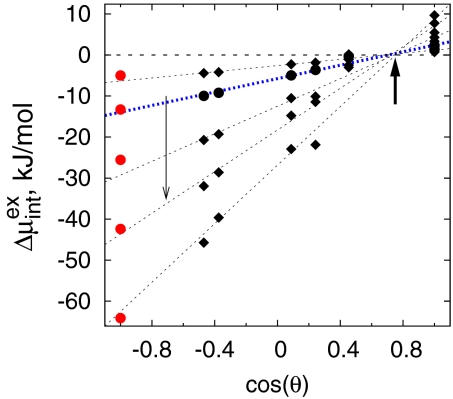
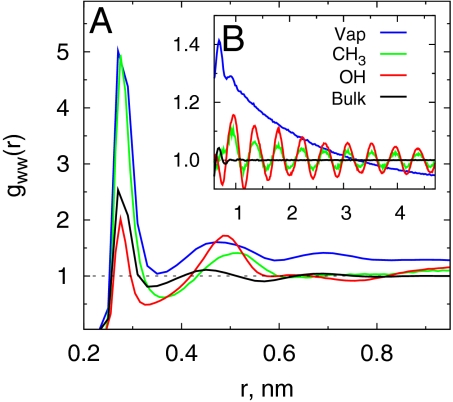
Hydrophobicity is often characterized macroscopically by the droplet contact angle. Molecular signatures of hydrophobicity have, however, remained elusive. Successful theories predict a drying transition leading to a vapor-like region near large hard-sphere solutes and interfaces. Adding attractions wets the interface with local density increasing with attractions. Here we present extensive molecular simulation studies of hydration of realistic surfaces with a wide range of chemistries from hydrophobic (-CF(3), -CH(3)) to hydrophilic (-OH, -CONH(2)). We show that the water density near weakly attractive hydrophobic surfaces (e.g., -CF(3)) can be bulk-like or larger, and provides a poor quantification of surface hydrophobicity. In contrast, the probability of cavity formation or the free energy of binding of hydrophobic solutes to interfaces correlates quantitatively with the macroscopic wetting properties and serves as an excellent signature of hydrophobicity. Specifically, the probability of cavity formation is enhanced in the vicinity of hydrophobic surfaces, and water-water correlations correspondingly display characteristics similar to those near a vapor-liquid interface. Hydrophilic surfaces suppress cavity formation and reduce the water-water correlation length. Our results suggest a potentially robust approach for characterizing hydrophobicity of more complex and heterogeneous surfaces of proteins and biomolecules, and other nanoscopic objects.


Conflict of interest statement

The authors declare no conflict of interest.

Figures

Fig. 1.
Fig. 1.
The SAM water system. (Upper) A snapshot of the −CH3 SAM system. The sulfur atoms (yellow) and surfactant head groups (cyan and white) are shown in spacefill representation. The alkane tail (cyan) and water (red and white) are shown with sticks. (Lower) Average density of SAM and water phases normal to the surface divided by their respective bulk densities (ρbs = 935 kg/m3 and ρbw = 985 kg/m3). The SAM bulk density was calculated by averaging over the region excluding the sulfur and head group atoms.
Fig. 2.
Fig. 2.
Water density near various surfaces. Mass density of water normal to the surface divided by its bulk value. The profiles are shifted horizontally for clarity. The vertical dashed lines with arrows indicate the location of intersection of surfactant and water-density profiles. The height of the first peak is indicated near the peak location.
Fig. 3.
Fig. 3.
Characterizing wetting of interfaces. Comparison of cos(θ) measured in our simulations (21) and in experiments (36). Snapshots of water droplets on nonwetting (−CF3), partially wetting (−CONHCH3), and wetting (−OH) SAMs are shown. Filled circles are for nanodroplets with diameter ≈5 nm (2,176 molecules); open circles are extrapolations to the macroscopic limit from drop-size-dependent simulations.
Fig. 4.
Fig. 4.
Characterizing interfacial width. (A and B) Density profiles of water and SAM in −CF3 and −CONH2 systems, respectively. Intercalation of water in the rough −CONH2 surface is seen in B. The dotted lines indicate locations of half density planes for SAM and water. The distance between these planes characterizes the interfacial width, and is shown in C as a function of experimental cos(θ). D shows total (SAM+water) density profiles for four surfaces.
Fig. 5.
Fig. 5.
Density fluctuations and cavity formation at different interfaces. (A) Probability distributions of number of heavy atoms in 3.3 Å-radius spherical volumes in bulk water and near interfaces. (B) The excess chemical potential of a methane-sized WCA solute normal to the surface, relative to that in the bulk. Curves are translated horizontally, such that minimum is at z* = 0. This corresponds to the solute being in contact with SAM, and SAM density being roughly 5% of its bulk density. This latter criterion was used for −OH and −CONH2 surfaces, for which a minimum is not observed. (C and D) The excess chemical potential of repulsive WCA (58) solutes of different sizes (σ = 0.25, 0.373, 0.560, 0.746, and 0.932 nm) relative to its value in bulk water as a function z at hydrophobic −CF3 and hydrophilic −CONH2 interfaces, respectively. The arrow points to increasing solute size. The curves are translated horizontally as above.
Fig. 6.
Fig. 6.
Molecular signatures of interfacial hydrophobicity. Excess chemical potentials of WCA solutes at the interface relative to that in the bulk, Δ μintex, as a function of surface wettability measured by the experimental cos(θ) (36). Data for WCA solutes with σ = 0.25, 0.373, 0.560, 0.746, and 0.932 nm are shown. Dotted lines show linear fits. Filled circles and the blue line are for methane-sized WCA solutes (σ = 0.373). The left arrow indicates increasing solute size. The right arrow highlights the convergence at cos(θ0) ≈0.7 or θ0 ≈45°. Δμintex = μbulkex/2 for the red data points placed at cos(θ) = −1, with μbulkex obtained from independent simulations.
Fig. 7.
Fig. 7.
Water–water correlations at different interfaces. (A) Water oxygen–oxygen pair correlations, gww(r), near −CH3 and −OH surfaces measured in a 0.1 nm-thick slab parallel to the interface located at the half-density plane of water. (B) gww(r) for r>1 nm. Water correlations measured similarly at a vapor–liquid interface and in bulk water are shown for reference. Because of the quasi-two-dimensional nature of gww(r), cylindrical shell normalization volumes were used in the calculations.

References

    1. Kauzmann W. Some factors in the interpretation of protein denaturation. Adv Protein Chem. 1959;14:1–63. - PubMed
    1. Tanford C. Contribution of hydrophobic interactions to stability of globular conformation of proteins. J Am Chem Soc. 1962;84:4240–4247.
    1. Dill KA. Dominant forces in protein folding. Biochemistry. 1990;29:7133–7155. - PubMed
    1. Chandler D. Interfaces and the driving force of hydrophobic assembly. Nature. 2005;437:640–647. - PubMed
    1. Granick S, Bae SC. Chemistry. A Curious Antipathy for Water. Science. 2008;322:1477–1478. - PubMed

Publication types