

Expression, mutation and copy number analysis of platelet-derived growth factor receptor A (PDGFRA) and its ligand PDGFA in gliomas
- PMID: 19707201
- PMCID: PMC2743351
- DOI: 10.1038/sj.bjc.6605225
Expression, mutation and copy number analysis of platelet-derived growth factor receptor A (PDGFRA) and its ligand PDGFA in gliomas
Abstract
Background: Malignant gliomas are the most prevalent type of primary brain tumours but the therapeutic armamentarium for these tumours is limited. Platelet-derived growth factor (PDGF) signalling has been shown to be a key regulator of glioma development. Clinical trials evaluating the efficacy of anti-PDGFRA therapies on gliomas are ongoing. In this study, we intended to analyse the expression of PDGFA and its receptor PDGFRA, as well as the underlying genetic (mutations and amplification) mechanisms driving their expression in a large series of human gliomas.
Methods: PDGFA and PDGFRA expression was evaluated by immunohistochemistry in a series of 160 gliomas of distinct World Health Organization (WHO) malignancy grade. PDGFRA-activating gene mutations (exons 12, 18 and 23) were assessed in a subset of 86 cases by PCR-single-strand conformational polymorphism (PCR-SSCP), followed by direct sequencing. PDGFRA gene amplification analysis was performed in 57 cases by quantitative real-time PCR (QPCR) and further validated in a subset of cases by chromogenic in situ hybridisation (CISH) and microarray-based comparative genomic hybridisation (aCGH).
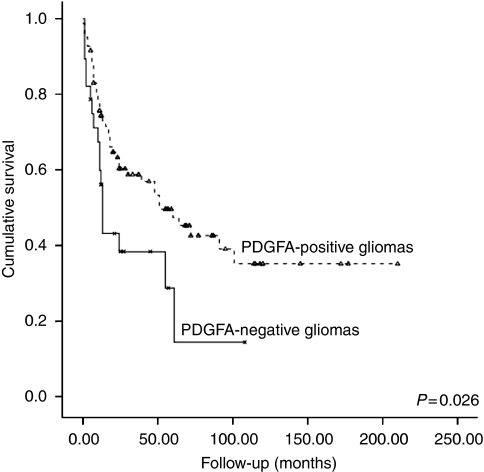
Results: PDGFA and PDGFRA expression was found in 81.2% (130 out of 160) and 29.6% (48 out of 160) of gliomas, respectively. Its expression was significantly correlated with histological type of the tumours; however, no significant association between the expression of the ligand and its receptor was observed. The absence of PDGFA expression was significantly associated with the age of patients and with poor prognosis. Although PDGFRA gene-activating mutations were not found, PDGFRA gene amplification was observed in 21.1% (12 out of 57) of gliomas. No association was found between the presence of PDGFRA gene amplification and expression, excepting for grade II diffuse astrocytomas.
Conclusion: The concurrent expression of PDGFA and PDGFRA in different subtypes of gliomas, reinforce the recognised significance of this signalling pathway in gliomas. PDGFRA gene amplification rather than gene mutation may be the underlying genetic mechanism driving PDGFRA overexpression in a portion of gliomas. Taken together, our results could provide in the future a molecular basis for PDGFRA-targeted therapies in gliomas.
Figures


References
-
- Alonso ME, Bello MJ, Arjona D, Martinez-Glez V, de Campos JM, Isla A, Kusak E, Vaquero J, Gutierrez M, Sarasa JL, Rey JA (2005) Real-time quantitative PCR analysis of gene dosages reveals gene amplification in low-grade oligodendrogliomas. Am J Clin Pathol 123: 900–906 - PubMed
-
- Arjona D, Bello MJ, Alonso ME, Isla A, de Campos JM, Vaquero J, Sarasa JL, Gutierrez M, Rey JA (2005) Real-time quantitative PCR analysis of regions involved in gene amplification reveals gene overdose in low-grade astrocytic gliomas. Diagn Mol Pathol 14: 224–229 - PubMed
-
- Arriola E, Lambros MBK, Jones C, Dexter T, Mackay A, Tan DSP, Tamber N, Fenwick K, Ashworth A, Dowsett M, Reis JS (2007) Evaluation of Phi29-based whole-genome amplification for microarray-based comparative genomic hybridisation. Lab Invest 87: 75–83 - PubMed
-
- Arriola E, Marchiò C, Tan DS, Drury SC, Lambros MB, Natrajan R, Rodriguez-Pinilla SM, Mackay A, Tamber N, Fenwick K, Jones C, Dowsett M, Ashworth A, Reis-Filho JS (2008) Genomic analysis of the HER2/TOP2A amplicon in breast cancer and breast cancer cell lines. Lab Invest 88: 491–503 - PubMed
-
- Basto D, Trovisco V, Lopes JM, Martins A, Pardal F, Soares P, Reis RM (2005) Mutation analysis of B-RAF gene in human gliomas. Acta Neuropathol (Berlin) 109: 207–210 - PubMed
Publication types
MeSH terms
Substances
Grants and funding
LinkOut - more resources
Full Text Sources
Other Literature Sources
Medical
Miscellaneous
