. 2009 Nov-Dec;15(11-12):371-83.
doi: 10.2119/molmed.2009.00094. Epub 2009 Aug 27.

European population genetic substructure: further definition of ancestry informative markers for distinguishing among diverse European ethnic groups

Affiliations

European population genetic substructure: further definition of ancestry informative markers for distinguishing among diverse European ethnic groups

Chao Tian et al. Mol Med. 2009 Nov-Dec.

Abstract

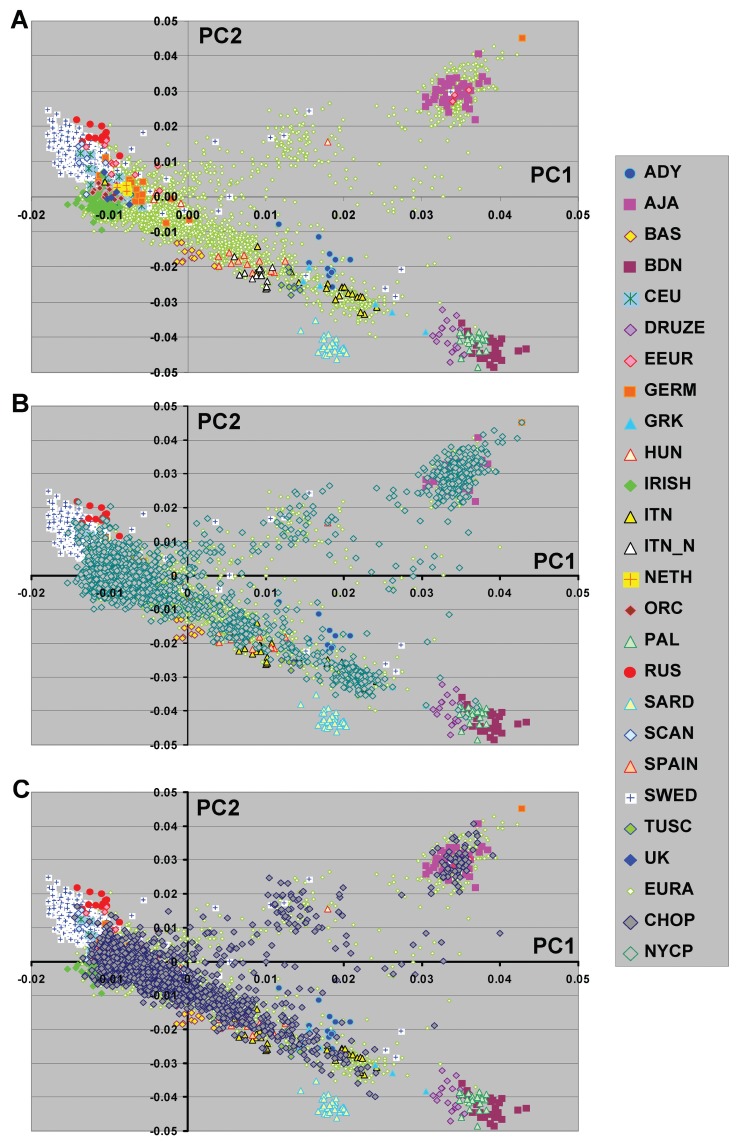
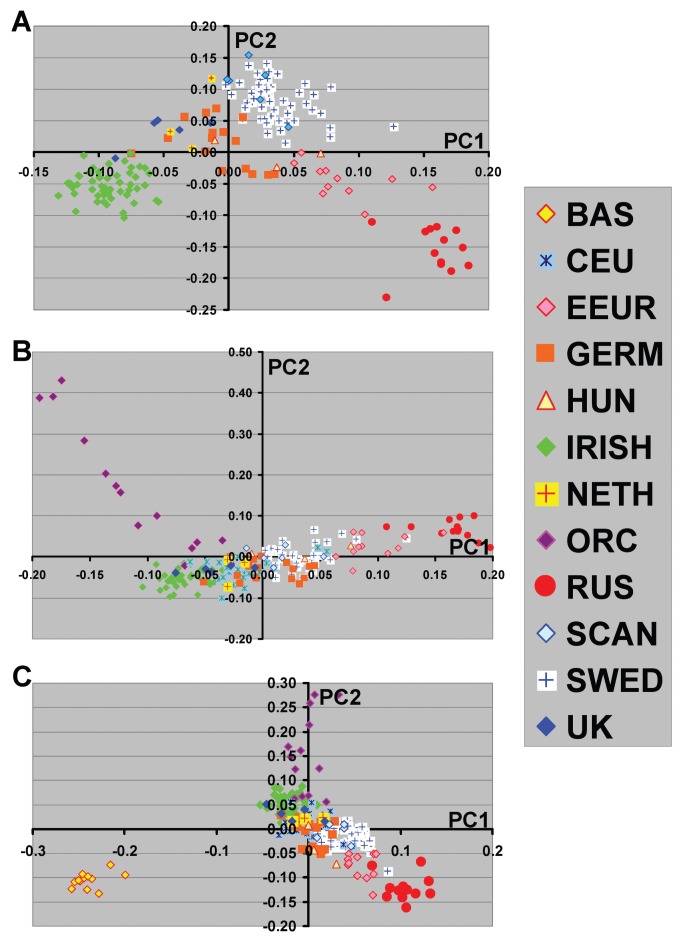
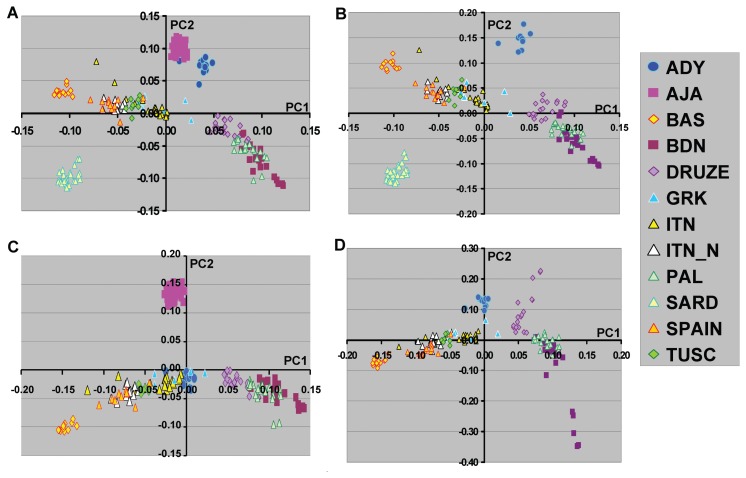
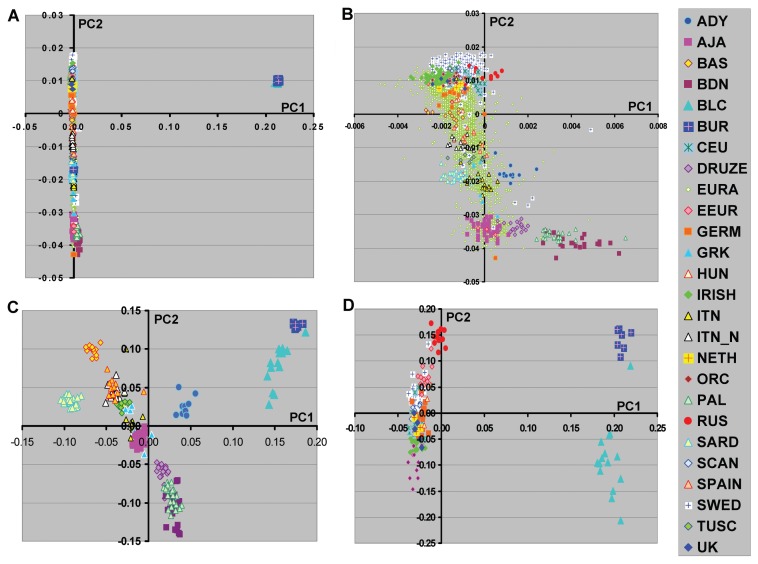
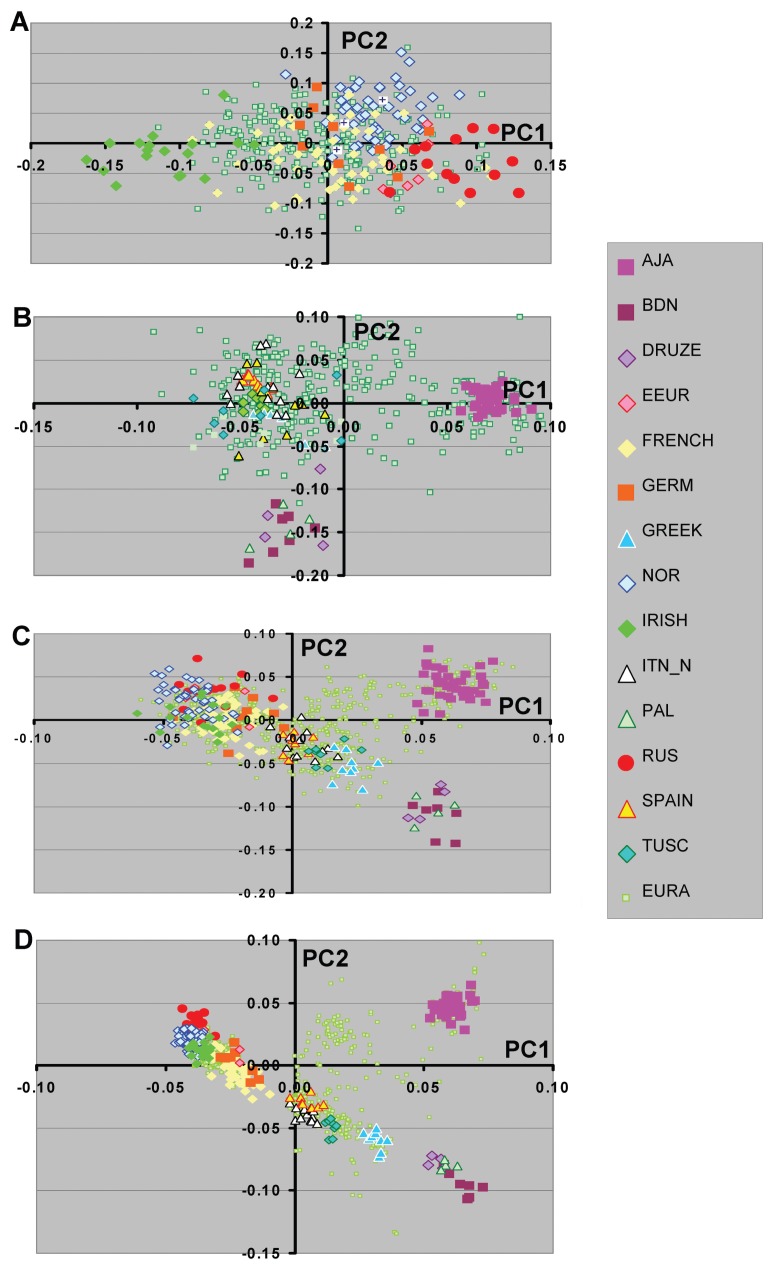
The definition of European population genetic substructure and its application to understanding complex phenotypes is becoming increasingly important. In the current study using over 4,000 subjects genotyped for 300,000 single-nucleotide polymorphisms (SNPs), we provide further insight into relationships among European population groups and identify sets of SNP ancestry informative markers (AIMs) for application in genetic studies. In general, the graphical description of these principal components analyses (PCA) of diverse European subjects showed a strong correspondence to the geographical relationships of specific countries or regions of origin. Clearer separation of different ethnic and regional populations was observed when northern and southern European groups were considered separately and the PCA results were influenced by the inclusion or exclusion of different self-identified population groups including Ashkenazi Jewish, Sardinian, and Orcadian ethnic groups. SNP AIM sets were identified that could distinguish the regional and ethnic population groups. Moreover, the studies demonstrated that most allele frequency differences between different European groups could be controlled effectively in analyses using these AIM sets. The European substructure AIMs should be widely applicable to ongoing studies to confirm and delineate specific disease susceptibility candidate regions without the necessity of performing additional genome-wide SNP studies in additional subject sets.


Figures

Figure 1
Figure 1
Principal component analyses of substructure in a diverse set of subjects of European descent. Graphic representation of the first two PCs based on analysis with >250K SNPs are shown. Color code shows subgroup of subjects for each population group. The subjects included Adygei (ADY, 12 subjects), Ashkenazi Jewish American (AJA, 40 subjects), Basque (BAS, 12 subjects), Bedouin (BDN, 23 subjects), CEPH European American (CEU, 48), Druze (20 subjects), Eastern European American (EEUR, 11 subjects), German American (GERM, 17 subjects), Greek American (GRK, 7), Hungarian American (HUN, 4 ), IRISH (84 subjects), Italian American (ITN, 20 subjects), northern Italian (ITN_N, 13 subjects), Dutch American (NETH, 3 subjects), Orcadian (ORC, 14 subjects), Palestinian (PAL, 22 subjects), Russian (RUS, 13 subjects), Sardinian (SARD, 28 subjects), Scandinavian American (SCAN, 6 subjects ), Spanish (SPAIN, 12 subjects), Swedish (SWED, 591 subjects), Tuscany (TUSC, 8 subjects), and United Kingdom American (UK, 5 subjects). Each of the specific country or ethnic color coded origins had consistent 4 grandparent origin information. The total number of individuals in this analysis was 4446. In panel A European Americans (EURA) without 4 grandparental information are shown (contains both NYCP and CHOP). Panels B and C illustrate the distribution of the EURA from NYCP (1873 subjects) and CHOP (1488 subjects), respectively.
Figure 2
Figure 2
Principal component analyses of Northern European populations. The color coded group membership is shown with the symbols corresponding to Figure 1 legend information. The subject sizes were as shown in Figure 1 with the exception of the Swedish group for which the sample size was reduced to 40 subjects. A, Northern European population groups without inclusion of Orcadian (ORC), CEU and Basque (BAS) subjects. B, and C, show PCA results when either ORC and CEU or BAS and CEU groups are added. Inclusion or exclusion of CEU did not affect the PCA pattern (data not shown).
Figure 3
Figure 3
Principal component analyses of Southern European populations. A, All subjects groups. B, PCA analysis without Ashkenazi Jewish American (AJA). C, PCA without the Sardinian (SARD) group. D, PCA without AJA and SARD. The subject numbers were the same as those indicated in Figure 1.
Figure 4
Figure 4
PCA analyses of European population groups together with two South Asian groups. A, All European population groups together with Balochi (BLC, 15 subjects) and Burusho (BUR, 7 subjects). B, Expanded view of European populations from PCA shown in A. C, PCA results from southern European population groups analyzed together with BAL and BUR. D, PCA results from northern European population groups analyzed together with BAL and BUR.
Figure 5
Figure 5
Ability of European Substructure AIMs to discern population substructure. A, PCA analysis of northern Europeans with North AIMs set 2. B, PCA analysis of Southern Europeans with South AIMs. C, PCA of all test population samples with EUROset2 ESAIMs. D, PCA of all test populations with 270 K SNPS. Note: The French subjects included only those identified as Northern European (~75% of subjects) and does not represent the diversity of all French subjects.

References

    1. Pritchard JK, Stephens M, Donnelly P. Inference of population structure using multilocus genotype data. Genetics. 2000;155:945–959. - PMC - PubMed
    1. Pritchard JK, Stephens M, Rosenberg NA, Donnelly P. Association mapping in structured populations. Am J Hum Genet. 2000;67:170–181. - PMC - PubMed
    1. Price AL, et al. Principal components analysis corrects for stratification in genome-wide association studies. Nat Genet. 2006;38:904–909. - PubMed
    1. Satten GA, Flanders WD, Yang Q. Accounting for unmeasured population substructure in case-control studies of genetic association using a novel latent-class model. Am J Hum Genet. 2001;68:466–477. - PMC - PubMed
    1. Hoggart CJ, et al. Control of confounding of genetic associations in stratified populations. Am J Hum Genet. 2003;72:1492–1504. - PMC - PubMed

Publication types

Substances

LinkOut - more resources