. 2009 Aug 26;4(8):e6763.
doi: 10.1371/journal.pone.0006763.

Man bites mosquito: understanding the contribution of human movement to vector-borne disease dynamics

Affiliations

Man bites mosquito: understanding the contribution of human movement to vector-borne disease dynamics

Ben Adams et al. PLoS One. .

Abstract

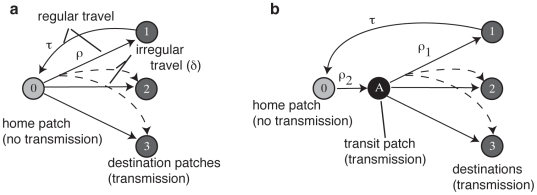
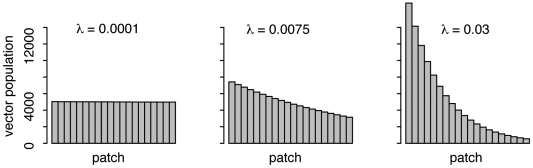
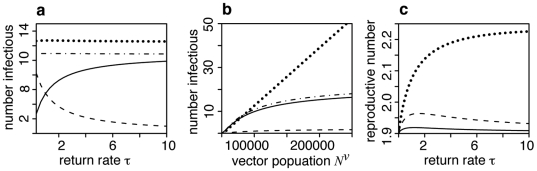
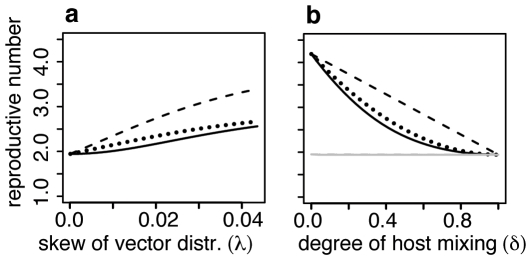
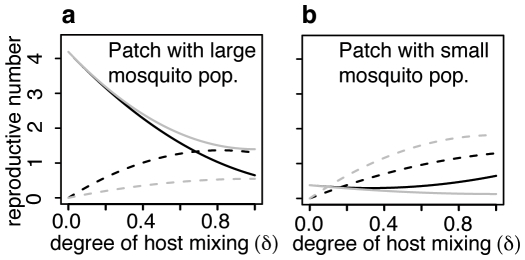
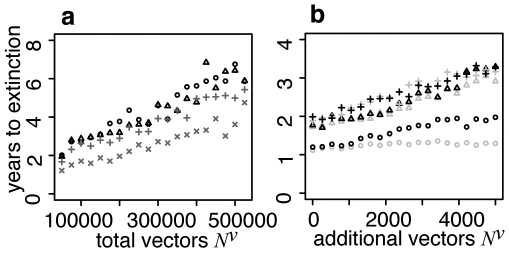
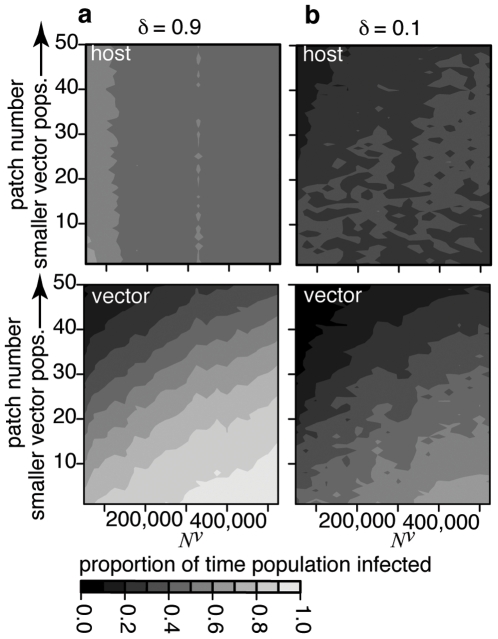
In metropolitan areas people travel frequently and extensively but often in highly structured commuting patterns. We investigate the role of this type of human movement in the epidemiology of vector-borne pathogens such as dengue. Analysis is based on a metapopulation model where mobile humans connect static mosquito subpopulations. We find that, due to frequency dependent biting, infection incidence in the human and mosquito populations is almost independent of the duration of contact. If the mosquito population is not uniformly distributed between patches the transmission potential of the pathogen at the metapopulation level, as summarized by the basic reproductive number, is determined by the size of the largest subpopulation and reduced by stronger connectivity. Global extinction of the pathogen is less likely when increased human movement enhances the rescue effect but, in contrast to classical theory, it is not minimized at an intermediate level of connectivity. We conclude that hubs and reservoirs of infection can be places people visit frequently but briefly and the relative importance of human and mosquito populations in maintaining the pathogen depends on the distribution of the mosquito population and the variability in human travel patterns. These results offer an insight in to the paradoxical observation of resurgent urban vector-borne disease despite increased investment in vector control and suggest that successful public health intervention may require a dual approach. Prospective studies can be used to identify areas with large mosquito populations that are also visited by a large fraction of the human population. Retrospective studies can be used to map recent movements of infected people, pinpointing the mosquito subpopulation from which they acquired the infection and others to which they may have transmitted it.


Conflict of interest statement

Competing Interests: The authors have declared that no competing interests exist.

Figures

Figure 1
Figure 1. Network for models with 3 destination patches.
a: basic model, people travel directly from home patch to destination and back. b: transit patch model, all people pass through the same transit patch (A) en route to their destination. Solid lines indicate regular travel patterns to (rate ρ) and fro (rate τ) patch 0 and patch j. For clarity the return route is only shown for patch 1. Dashed lines indicate irregular travel patterns, the frequency of which is controlled by δ. For clarity these have been omitted for the subpopulations regularly travelling to patches 2 and 3.
Figure 2
Figure 2. Role of parameter λ in determining the distribution of total mosquito population Nv = 100,000 between n = 20 patches (Supplementary Information S1 equation 2).
Values of λ close to 0 give an almost uniform distribution, larger values of λ give increasingly skewed distributions.
Figure 3
Figure 3. Endemic equilibrium solutions and basic reproductive number of model with one destination patch.
a, b: Number of infectious hosts in patch 0 (Ih 0, solid line), patch 1 (Ih 1, dashed line) and in total (Ih 0+Ih 1, dot-dash line) and the number of infectious mosquitoes in patch 1(Iv, dotted line) as functions of the rate at which hosts leave patch 1 (τ) and mosquito population size (Nv). Larger values of τ correspond to a shorter residence time in patch 1. c: Basic reproductive number (R 0 2) as a function of τ. Line styles indicate the within-host incubation rate: εh = 0.2 (solid), 1 (dashed), 200 (dotted). The duration of incubation is 1h days.
Figure 4
Figure 4. Reproductive numbers of the approximate model with 3 destination patches evaluated in the patch with largest vector population.
a: as a function of the degree of skew in the vector population distribution (λ) when host mixing is intermediate (δ = 0.5). b: as a function of the degree of host mixing (δ) when the vector population distribution is highly skewed (λ = 0.03, black lines) and uniform (λ = 0.0001, overlapping grey lines). Solid line is the global R 0 2 for the entire metapopulation calculated using the next generation method. The dashed line is the host reproductive number (R 0 h j) associated with the patch (j) with the highest mosquito density. The dotted line is the vector reproductive number for the same patch (R 0 v j).
Figure 5
Figure 5. Components of the host and vector reproductive numbers (R 0 h j, R 0 v j) of the approximate model with three destination patches and a highly skewed (λ = 0.03) vector population evaluated in the patches with the largest (a) and smallest (b) vector populations as a function of the degree of host mixing (δ).
The initial infected individual is in patch j. Solid line is the component of the reproductive number related to transmission within patch j. Dashed line is the component related to transmission to patches other than j. Black lines correspond to the host-vector-host transmission cycle. Grey lines correspond to the vector-host-vector transmission cycle.
Figure 6
Figure 6. Mean time to extinction, in years, calculated by applying a stochastic solver to the approximate version of the model with discrete host and vector populations and 50 patches.
Each plotted point is the average of 100 trials. The initial conditions were constructed by applying a deterministic solver to find the endemic equilibrium and rounding up all fractional population sizes. Where the endemic equilibrium was unstable, the disease free equilibrium was modified so that there was one infected and infectious host and vector in each patch. a: Time to extinction as a function of the total vector population Nv in the basic model. Pluses: skewed vector distribution (λ = 0.03) and weak host mixing (δ = 0.1). Crosses: uniform vector distribution (λ = 0.0001) and weak host mixing. Triangles: skewed vector distribution and strong host mixing (δ = 0.9). Circles: uniform vector distribution and strong host mixing. b: Time to extinction as a function of the number of vectors additional to 50,000 in the total vector population for the model with a transit patch. Black – additional vectors all in transit patch (A). Grey – additional vectors evenly divided between normal destination patches (control). Circles – no host mixing between destination patches (δ = 0). Triangles – weak host mixing (δ = 0.1). Crosses – strong host mixing (δ = 0.9). Except for transit patch, vector population evenly distributed between 50 destination patches.
Figure 7
Figure 7. Patch occupancy expressed as the mean proportion of the total time to extinction that there is at least one infection in the host (Eh or Ih) or vector (Ev or Iv) in each patch as a function of the total vector population Nv.
Calculated using a stochastic solver for the approximate version of the model with 50 patches, a: strong (δ = 0.9) and b: weak (δ = 0.1) host mixing and a skewed (λ = 0.03) vector distribution between patches. Paler shades indicate a subpopulation is infected for a greater proportion of time. Each point is the average of 25 trials with initial condition close to the endemic equilibrium found using a deterministic solver.

References

    1. Pearn J. Arthropods and disease: the evolution of knowledge about vector-borne disease. 2004. The International Society of the History of Medicine, 39th International Congress Bari, Italy.
    1. McKenzie FE. Why model malaria? Parasitol Today. 2000;16:511–516. - PubMed
    1. Ooi EE, Goh KT, Gubler DJ. Dengue prevention and 35 years of vector control in Singapore. Emerg Infect Dis. 2006;12:887–893. - PMC - PubMed
    1. Chan YC, Chan KL, Ho BC. Aedes-Aegypti (L.) and Aedes-Albopictus (Skuse) in Singapore-City.1. Distribution and Density. Bulletin of the World Health Organization. 1971;44:617–&. - PMC - PubMed
    1. Morrison AC, Getis A, Santiago M, Rigau-Perez JG, Reiter P. Exploratory space-time analysis of reported dengue cases during an outbreak in Florida, Puerto Rico, 1991–1992. Am J Trop Med Hyg. 1998;58:287–298. - PubMed

Publication types