. 2009 Aug 26;4(8):e6766.
doi: 10.1371/journal.pone.0006766.

Disruption of histone modification and CARM1 recruitment by arsenic represses transcription at glucocorticoid receptor-regulated promoters

Affiliations

Disruption of histone modification and CARM1 recruitment by arsenic represses transcription at glucocorticoid receptor-regulated promoters

Fiona D Barr et al. PLoS One. .

Abstract

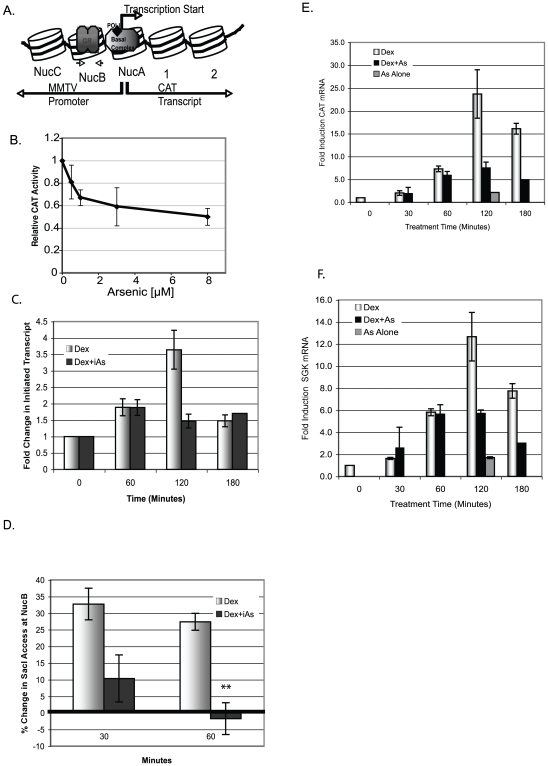
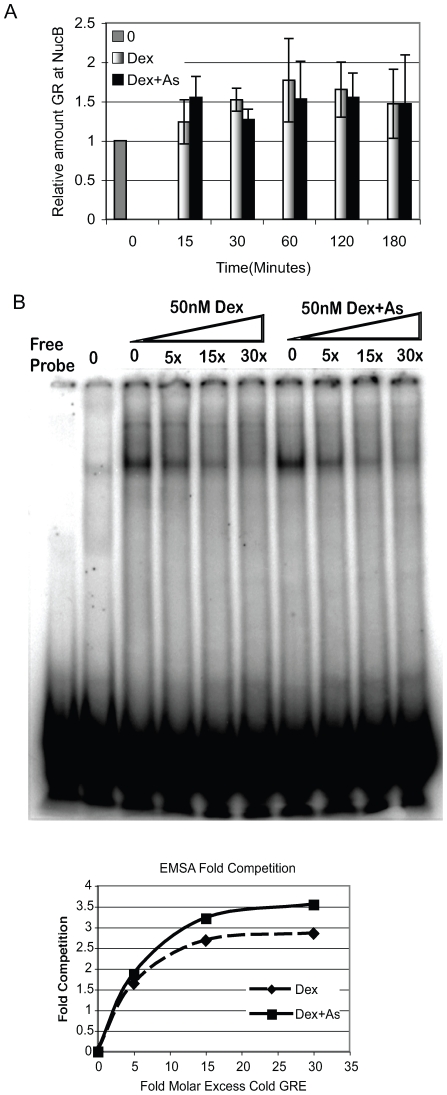
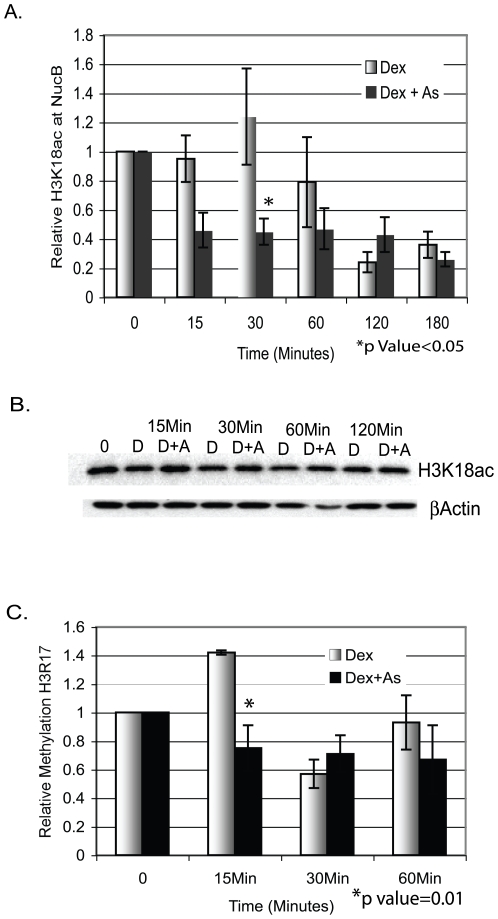
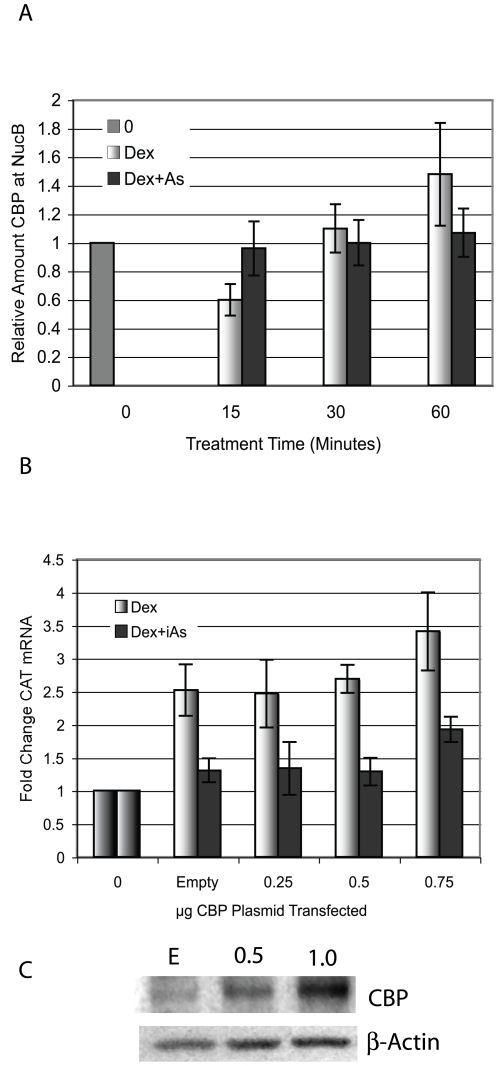
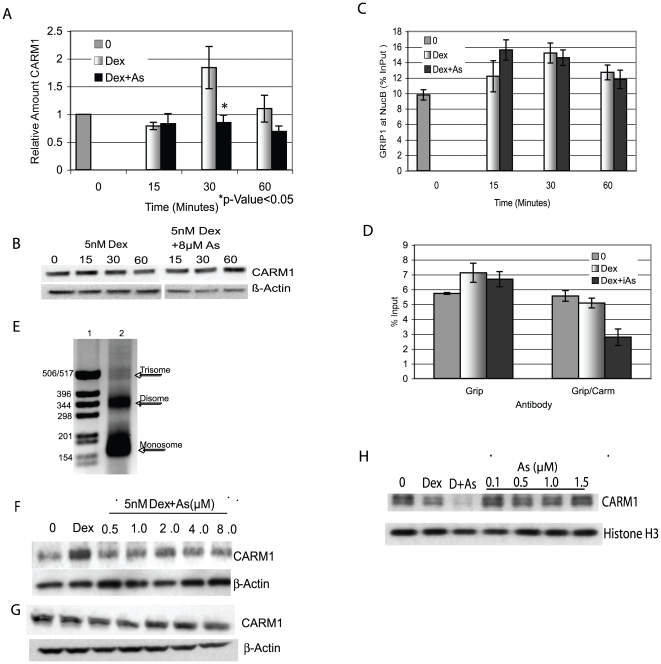
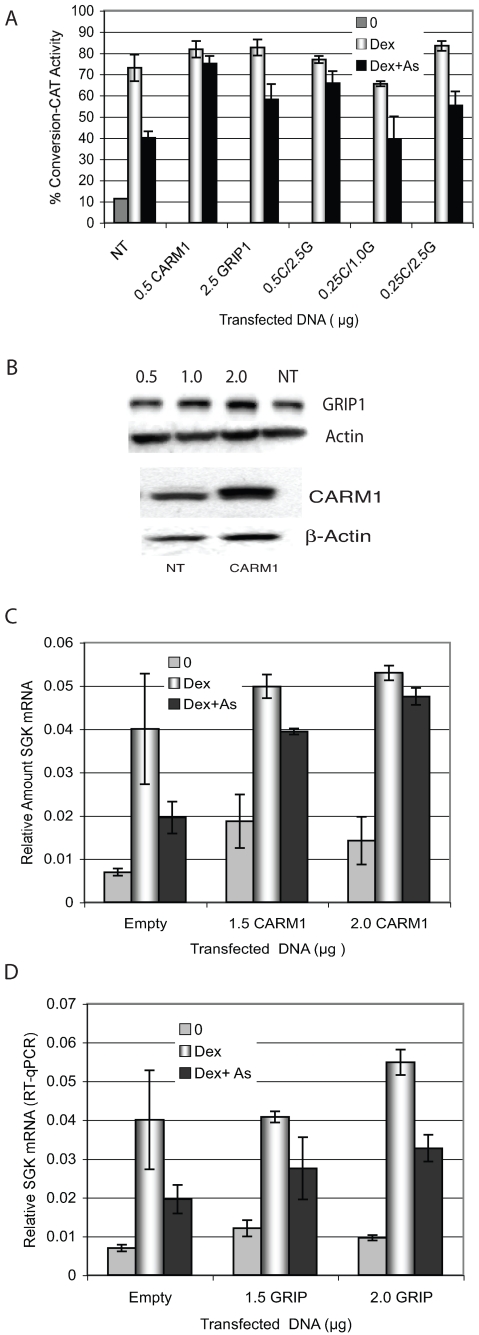
Chronic exposure to inorganic arsenic (iAs) found in the environment is one of the most significant and widespread environmental health risks in the U.S. and throughout the world. It is associated with a broad range of health effects from cancer to diabetes as well as reproductive and developmental anomalies. This diversity of diseases can also result from disruption of metabolic and other cellular processes regulated by steroid hormone receptors via aberrant transcriptional regulation. Significantly, exposure to iAs inhibits steroid hormone-mediated gene activation. iAs exposure is associated with disease, but is also used therapeutically to treat specific cancers complicating an understanding of iAs action. Transcriptional activation by steroid hormone receptors is accompanied by changes in histone and non-histone protein post-translational modification (PTM) that result from the enzymatic activity of coactivator and corepressor proteins such as GRIP1 and CARM1. This study addresses how iAs represses steroid receptor-regulated gene transcription. PTMs on histones H3 and H4 at the glucocorticoid receptor (GR)-activated mouse mammary tumor virus (MMTV) promoter were identified by chromatin immunoprecipitation analysis following exposure to steroid hormone+/-iAs. Histone H3K18 and H3R17 amino acid residues had significantly different patterns of PTMs after treatment with iAs. Promoter interaction of the coactivator CARM1 was disrupted, but the interaction of GRIP1, a p160 coactivator through which CARM1 interacts with a promoter, was intact. Over-expression of CARM1 was able to fully restore and GRIP1 partially restored iAs-repressed transcription indicating that these coactivators are functionally associated with iAs-mediated transcriptional repression. Both are essential for robust transcription at steroid hormone regulated genes and both are associated with disease when inappropriately expressed. We postulate that iAs effects on CARM1 and GRIP1 may underlie some of its therapeutic effects and as well be associated with its toxic effects.


Conflict of interest statement

Competing Interests: The authors have declared that no competing interests exist.

Figures

Figure 1
Figure 1. iAs inhibits transcription from the MMTV and SGK promoters.
(A) MMTV promoter with Nucs A–C. Large arrow indicates transcription start site and small arrows, PCR primers in NucB. (B) CAT activity in 1470.2 cells treated (4 h) with 100 nM Dex±iAs. CAT activity expressed as a ratio relative to cells treated with 100 nM Dex alone (arbitrarily set at 1). n = 3 replicates in a representative experiment. (C) Nuclear run-on analysis from the MMTV promoter in cells treated with 5 nM Dex±8 µM iAs for times indicated. Fold change = (CAT mRNA hybridized- background (pUC))/5s RNA) relative to basal transcription (no treatment) arbitrarily set to one. n = 3 replicates from two independent experiments. (D) REAA with restriction enzyme Sac1. SacI-digested DNA from cells treated for 30 or 60 min with 5 nM Dex±8 µM iAs indicates an “open” or “closed” chromatin template at MMTV NucB measured by qPCR with primers that span the SacI site in NucB. The zero value represents basal SacI digestion to which all treated values were compared. n = 3 independent experiments. **P-value<0.01. (E & F) CAT or SGK mRNA measured by qRT-PCR. Cells treated with 5 nMDex±8 µM iAs for times indicated. Both (E&F) are data from the same experiment done in triplicate that is representative of 2 independent experiments.
Figure 2
Figure 2. GR binds to the MMTV promoter equally in the presence of Dex±iAs.
(A) ChIP analysis of GR interaction with NucB. Cells were treated with 5 nMDex±8 µM iAs and ChIP assays were done with antibody to GR. NucB bound by GR was quantified by qPCR or by conventional PCR. n = 7–8 independent experiments. (B) EMSAs done with NEs from 1470.2 cells that were untreated (lane 2–0) or treated with 50 nM Dex±8 µM iAs for 30 minutes. [32P]-labeled consensus GRE±5, 15, and 30-fold molar excess unlabeled competitor GRE visualized as shifted band by PhosphorImager analysis. The Inset graph shows the competition quantified (shifted probe/(Free+shifted)) from each reaction shown.
Figure 3
Figure 3. iAs inhibits histone H3K18 acetylation and H3R17 methylation.
(A) 1470.2 cells were treated with 5nM Dex±8 µM iAs for the indicated times and ChIP assays were done with an antibody to H3K18ac. H3K18ac at NucB represents qPCR values from primers/probe to NucB corrected for Input DNA, expressed as a ratio of treated to untreated cells (0) arbitrarily set to 1. n = 4–5 independent experiments. (B) Western blot analysis of NEs from cells treated as above with antibody to H3K18ac and b-actin. (C) 1470.2 cells treated with 5 nM Dex±8 µM iAs as above and ChIP assays were done with an antibody to H3R17me. qPCR was done with primers/probe to NucB and analyzed as above. n = 3–5 independent experiments.
Figure 4
Figure 4. CBP binds to the MMTV promoter in the presence of iAs but does not restore iAs-repressed transcription.
(A) ChIP assay in 1470.2 cells with an antibody to CBP. Treatment was with 5 nM Dex±8 µM iAs for the times indicated. qPCR was done with primers to NucB and values were corrected for Input DNA and expressed as a ratio of treated to untreated (0) arbitrarily set to 1. n = 9 independent experiments. (B) Cells were transfected with pcDNA3-CBP-Flag or Empty vector at indicated concentrations and treated with 5 nM Dex±8 µM iAs for 24 h. Zero is untreated baseline activity. CAT mRNA was measured by RT-qPCR corrected for b-actin mRNA. The values indicated on the y-axis are fold changes in the RT-qPCR Units. n = 4 independent experiments. (C) Empty vector (E) or pcDNA3-CBP-Flag was transfected at the concentrations indicated (µg) and western blot analysis was done to determine CBP protein over-expression.
Figure 5
Figure 5. CARM1 but not GRIP1 interaction with the MMTV promoter is disrupted by iAs.
(A) ChIP assay with an antibody to CARM1 of 1470.2 cells treated with 5 nM Dex±8 µM iAs. qPCR was done with primers to NucB and values were corrected for Input DNA and expressed as a ratio of treated to untreated (0) arbitrarily set to 1. n = 4–6 independent experiments. (B) Western blot analysis of NEs treated as above incubated with antibodies to CARM1 or b-actin. (C) ChIP assays and analysis as in (A) done with an antibody to GRIP1. Experiment shown is representative of 3 independent experiments. n = 3 replicates. (D) Sequential ChIP analysis with antibodies to GRIP1 (first Ip) and CARM1 (second Ip). qPCR primers were to NucB and values expressed as NucB/InPuts (%InPut). Experiment shown is representative of 4 independent experiments. n = 3 replicates. (E) CARM1 bound to the MMTV promoter decreases in the presence of iAs in an in vitro pull-down assay. Micrococcal nuclease digestion of an in vitro assembled MMTV with Nucs A–C. DNA was visualized by agarose gel electrophoresis. Lane1 = Molecular weight markers and Lane 2 = MNase digested MMTV assembled template. (F) In vitro assembled MMTV promoter (Nucs A–C) incubated with 60 µg NE from cells treated for 30 minutes with 5 nM Dex±iAs from 0.5 to 8 µM. Proteins bound to the MMTV in vitro template were separated by SDS-PAGE followed by western blot analysis with antibodies to CARM1 or to b-actin. A representative experiment repeated twice is shown. (G) Western blot analysis of NEs treated as in (F) incubated with antibodies to CARM1 or b-actin. (H) NEs from cells treated with 5 nM Dex incubated with the in vitro template and exogenously added iAs from 0.1 to 1.5 µM. Western blot of MMTV-associated proteins with antibody to CARM1. Lane 0 = NE from untreated cells, Lane “Dex” = NE from 5 nM Dex treated cells and Lane “D+As” is NE from cells treated with 5 nM Dex+8 µM iAs. Below is the same blot incubated with antibodies to histone H3. Representative of an experiment repeated twice.
Figure 6
Figure 6. Over-expression of CARM1 restores iAs-mediated transcriptional repression.
(A) Cells were transfected with pSG5-HA-CARM1, pSG5-GRIP1/FL or a combination of the two expression plasmids at indicated concentrations and treated with 5 nM Dex±8 µM iAs for 24 h. CAT activity was measured and expressed as percent conversion from unacetylated to acetylated chloramphenicol. Representative of an experiment repeated 3 times n = 3 replicate points. (B) Western blot analysis of proteins from cells transfected with 0.5 µg of pSG5-HA-CARM1 or pSG5-GRIP1/FL plasmid or non-transfected cells (NT), incubated with antibodies to CARM1, GRIP1 and b-actin. The HA-tagged CARM1 migrates slightly higher in the gel than endogenous CARM1. (C) Cells transfected with pSG5-HA-CARM1 at the indicated concentrations or pSG5-HA-EMPTY at 1.5 µg and treated for 2 hours with 5 nM Dex±8 µM iAs. SGK mRNA was measured by RT-qPCR corrected for actin mRNA. The values indicated on the y-axis are RT-qPCR Units. Experimental points are in triplicate and the experiment was repeated twice. (D) pSG5-GRIP1/FL or Empty vector was over-expressed in cells at the concentrations indicated and SGK mRNA was measured by RT-qPCR and analyzed as in (C).

References

    1. Smith AH, Lopipero PA, Bates MN, Steinmaus CM. Public health. Arsenic epidemiology and drinking water standards. Science. 2002;296:2145–2146. - PubMed
    1. NRC . Washington, DC: National Academies Press; 2001. Arsenic in Drinking Water-2001 Update.
    1. Heldring N, Pike A, Andersson S, Matthews J, Cheng G, et al. Estrogen receptors: how do they signal and what are their targets. Physiological reviews. 2007;87:905–931. - PubMed
    1. Vegiopoulos A, Herzig S. Glucocorticoids, metabolism and metabolic diseases. Mol Cell Endocrinol. 2007;275:43–61. - PubMed
    1. Jacobsen BM, Schittone SA, Richer JK, Horwitz KB. Progesterone-independent effects of human progesterone receptors (PRs) in estrogen receptor-positive breast cancer: PR isoform-specific gene regulation and tumor biology. Mol Endocrinol. 2005;19:574–587. - PubMed

Publication types

MeSH terms

Substances