

Energy sprawl or energy efficiency: climate policy impacts on natural habitat for the United States of America
- PMID: 19707570
- PMCID: PMC2728545
- DOI: 10.1371/journal.pone.0006802
Energy sprawl or energy efficiency: climate policy impacts on natural habitat for the United States of America
Abstract
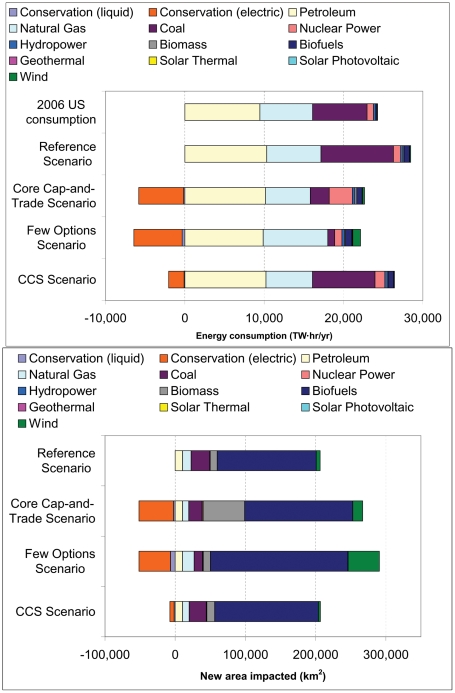
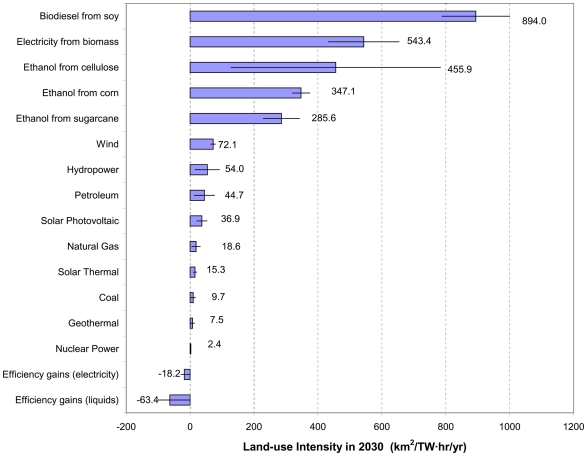
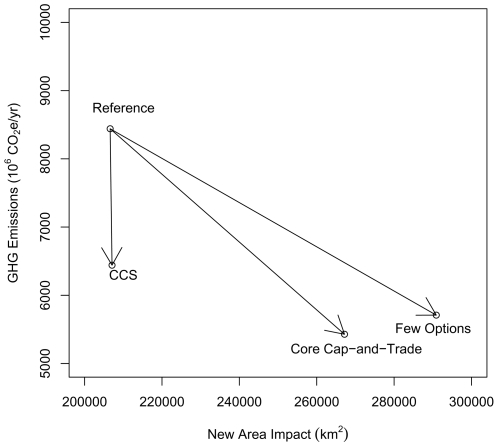
Concern over climate change has led the U.S. to consider a cap-and-trade system to regulate emissions. Here we illustrate the land-use impact to U.S. habitat types of new energy development resulting from different U.S. energy policies. We estimated the total new land area needed by 2030 to produce energy, under current law and under various cap-and-trade policies, and then partitioned the area impacted among habitat types with geospatial data on the feasibility of production. The land-use intensity of different energy production techniques varies over three orders of magnitude, from 1.9-2.8 km(2)/TW hr/yr for nuclear power to 788-1000 km(2)/TW hr/yr for biodiesel from soy. In all scenarios, temperate deciduous forests and temperate grasslands will be most impacted by future energy development, although the magnitude of impact by wind, biomass, and coal to different habitat types is policy-specific. Regardless of the existence or structure of a cap-and-trade bill, at least 206,000 km(2) will be impacted without substantial increases in energy efficiency, which saves at least 7.6 km(2) per TW hr of electricity conserved annually and 27.5 km(2) per TW hr of liquid fuels conserved annually. Climate policy that reduces carbon dioxide emissions may increase the areal impact of energy, although the magnitude of this potential side effect may be substantially mitigated by increases in energy efficiency. The possibility of widespread energy sprawl increases the need for energy conservation, appropriate siting, sustainable production practices, and compensatory mitigation offsets.
Conflict of interest statement
Figures
References
-
- Tyner WE. The US ethanol and biofuels boom: Its origins, current status, and future prospects. Bioscience. 2008;58:646–653.
-
- Pimentel D, Herz M, Glickstein M, Zimmerman M, Allen R, et al. Renewable energy: current and potential issues. In: Pimentel D, Pimentel M, editors. Food, Energy, and Society. London: CRC Press; 2007.
-
- Spitzley DV, Keoleian GA. Ann Arbor, MI: Center for Sustainable Systems, University of Michigan; 2004. Life cycle environmental and economic assessment of willow biomass electricity: A comparison with other renewable and non-renewable sources.
-
- Koh LP, Wilcove DS. Is oil palm agriculture really destroying tropical biodiversity? Conservation Letters. 2008;1:60–64.
-
- Groom MJ, Gray EM, Townsend PA. Biofuels and biodiversity: Principles for creating better policies for biofuel production. Conservation Biology. 2008;22:602–609. - PubMed
Publication types
MeSH terms
LinkOut - more resources
Full Text Sources
Miscellaneous
