

Craniometric data supports demic diffusion model for the spread of agriculture into Europe
- PMID: 19707595
- PMCID: PMC2727056
- DOI: 10.1371/journal.pone.0006747
Craniometric data supports demic diffusion model for the spread of agriculture into Europe
Abstract
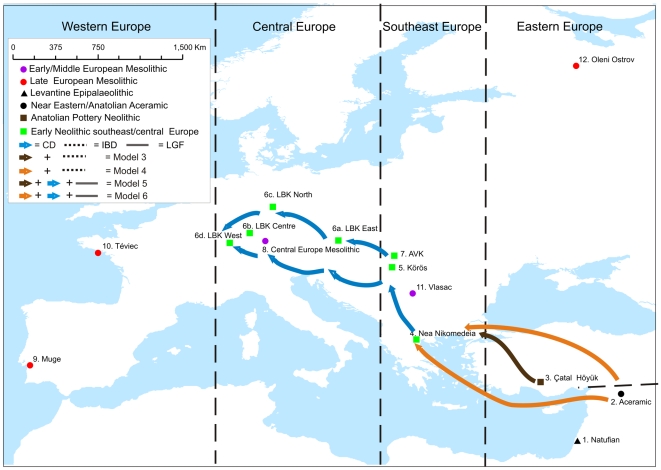
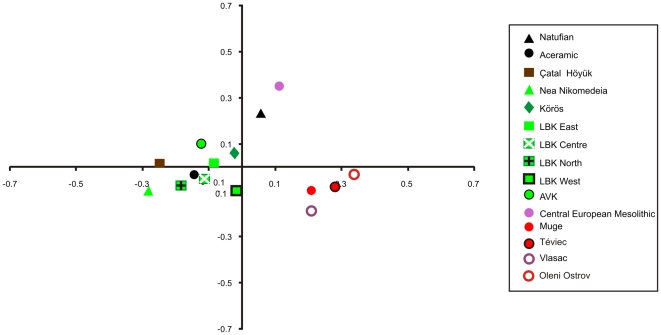
Background: The spread of agriculture into Europe and the ancestry of the first European farmers have been subjects of debate and controversy among geneticists, archaeologists, linguists and anthropologists. Debates have centred on the extent to which the transition was associated with the active migration of people as opposed to the diffusion of cultural practices. Recent studies have shown that patterns of human cranial shape variation can be employed as a reliable proxy for the neutral genetic relationships of human populations.
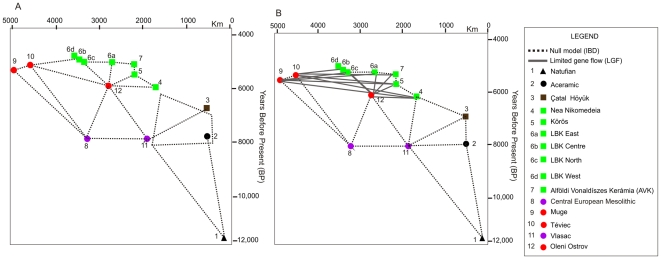
Methodology/principal findings: Here, we employ measurements of Mesolithic (hunter-gatherers) and Neolithic (farmers) crania from Southwest Asia and Europe to test several alternative population dispersal and hunter-farmer gene-flow models. We base our alternative hypothetical models on a null evolutionary model of isolation-by-geographic and temporal distance. Partial Mantel tests were used to assess the congruence between craniometric distance and each of the geographic model matrices, while controlling for temporal distance. Our results demonstrate that the craniometric data fit a model of continuous dispersal of people (and their genes) from Southwest Asia to Europe significantly better than a null model of cultural diffusion.
Conclusions/significance: Therefore, this study does not support the assertion that farming in Europe solely involved the adoption of technologies and ideas from Southwest Asia by indigenous Mesolithic hunter-gatherers. Moreover, the results highlight the utility of craniometric data for assessing patterns of past population dispersal and gene flow.
Conflict of interest statement
Figures
References
-
- Ammerman AJ, Cavalli-Sforza LL. Measuring the rate of spread of early farming in Europe. Man NS. 1971;6:674–688.
-
- Ammerman AJ, Cavalli-Sforza LL. A population model for the diffusion of early farming in Europe. In: Renfrew C, editor. The explanation of culture change. London: Duckworth; 1973. pp. 343–357.
-
- Ammerman AJ, Cavalli-Sforza LL. Princeton, NJ: Princeton University Press; 1984. The Neolithic transition and the genetics of populations in Europe.200
-
- Dennell R. Orlando, FL: Academic Press; 1983. European economic prehistory: A new approach.240
-
- Whittle A. Cambridge: Cambridge University Press; 1996. Europe in the Neolithic: The creation of new worlds.460
MeSH terms
LinkOut - more resources
Full Text Sources
Miscellaneous
