

Practical anticipation of human efficacious doses and pharmacokinetics using in vitro and preclinical in vivo data
- PMID: 19707878
- PMCID: PMC2758129
- DOI: 10.1208/s12248-009-9136-x
Practical anticipation of human efficacious doses and pharmacokinetics using in vitro and preclinical in vivo data
Abstract
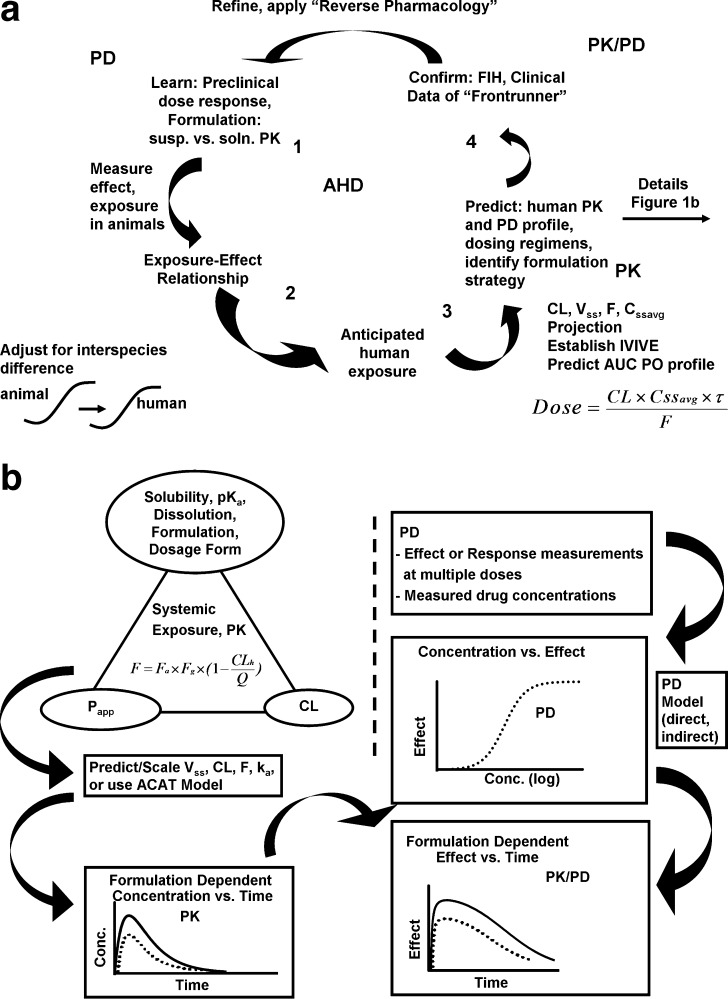
Accurate predictions of human pharmacokinetic and pharmacodynamic (PK/PD) profiles are critical in early drug development, as safe, efficacious, and "developable" dosing regimens of promising compounds have to be identified. While advantages of successful integration of preclinical PK/PD data in the "anticipation" of human doses (AHD) have been recognized, pharmaceutical scientists have faced difficulties with practical implementation, especially for PK/PD profile projections of compounds with challenging absorption, distribution, metabolism, excretion and formulation properties. In this article, practical projection approaches for formulation-dependent human PK/PD parameters and profiles of Biopharmaceutics Classification System classes I-IV drugs based on preclinical data are described. Case examples for "AHD" demonstrate the utility of preclinical and clinical PK/PD modeling for formulation risk identification, lead candidate differentiation, and prediction of clinical outcome. The application of allometric scaling methods and physiologically based pharmacokinetic approaches for clearance or volume of distribution projections is described using GastroPlus. Methods to enhance prediction confidence such as in vitro-in vivo extrapolations in clearance predictions using in vitro microsomal data are discussed. Examples for integration of clinical PK/PD and formulation data from frontrunner compounds via "reverse pharmacology strategies" that minimize uncertainty with PK/PD predictions are included. The use of integrated softwares such as GastroPlus in combination with established PK projection methods allow the projection of formulation-dependent preclinical and human PK/PD profiles required for compound differentiation and development risk assessments.
Figures
Similar articles
-
Pharmacokinetics in Drug Discovery: An Exposure-Centred Approach to Optimising and Predicting Drug Efficacy and Safety.Handb Exp Pharmacol. 2016;232:235-60. doi: 10.1007/164_2015_26. Handb Exp Pharmacol. 2016. PMID: 26330260 Review.
-
Preclinical pharmacokinetic/pharmacodynamic modeling and simulation in the pharmaceutical industry: an IQ consortium survey examining the current landscape.AAPS J. 2015 Mar;17(2):462-73. doi: 10.1208/s12248-014-9716-2. Epub 2015 Jan 29. AAPS J. 2015. PMID: 25630504 Free PMC article.
-
Prospective Predictions of Human Pharmacokinetics for Eighteen Compounds.J Pharm Sci. 2015 Sep;104(9):2795-806. doi: 10.1002/jps.24373. Epub 2015 Feb 17. J Pharm Sci. 2015. PMID: 25690565
-
Translational prediction of first-in-human pharmacokinetics and pharmacodynamics of janagliflozin, a selective SGLT2 inhibitor, using allometric scaling, dedrick and PK/PD modeling methods.Eur J Pharm Sci. 2020 Apr 30;147:105281. doi: 10.1016/j.ejps.2020.105281. Epub 2020 Feb 29. Eur J Pharm Sci. 2020. PMID: 32126254
-
Preclinical pharmacokinetics: an approach towards safer and efficacious drugs.Curr Drug Metab. 2006 Feb;7(2):165-82. doi: 10.2174/138920006775541552. Curr Drug Metab. 2006. PMID: 16472106 Review.
Cited by
-
Allometric Scaling Approaches for Predicting Human Pharmacokinetic of a Locked Nucleic Acid Oligonucleotide Targeting Cancer-Associated miR-221.Cancers (Basel). 2019 Dec 19;12(1):27. doi: 10.3390/cancers12010027. Cancers (Basel). 2019. PMID: 31861748 Free PMC article.
-
Pharmacokinetic/Pharmacodynamic Modeling of the PDE4 Inhibitor TAK-648 in Type 2 Diabetes: Early Translational Approaches for Human Dose Prediction.Clin Transl Sci. 2017 May;10(3):185-193. doi: 10.1111/cts.12436. Epub 2017 Jan 15. Clin Transl Sci. 2017. PMID: 28088839 Free PMC article. Clinical Trial.
-
Pharmacokinetic-pharmacodynamic modelling of the anti-FcRn monoclonal antibody rozanolixizumab: Translation from preclinical stages to the clinic.CPT Pharmacometrics Syst Pharmacol. 2022 Jan;11(1):116-128. doi: 10.1002/psp4.12739. Epub 2021 Nov 23. CPT Pharmacometrics Syst Pharmacol. 2022. PMID: 34735735 Free PMC article.
-
Application of an Accessible Interface for Pharmacokinetic Modeling and In Vitro to In Vivo Extrapolation.Front Pharmacol. 2022 Apr 13;13:864742. doi: 10.3389/fphar.2022.864742. eCollection 2022. Front Pharmacol. 2022. PMID: 35496281 Free PMC article.
-
Application of Absorption Modeling in Rational Design of Drug Product Under Quality-by-Design Paradigm.AAPS J. 2015 Sep;17(5):1224-36. doi: 10.1208/s12248-015-9781-1. Epub 2015 May 22. AAPS J. 2015. PMID: 26002509 Free PMC article.
References
MeSH terms
LinkOut - more resources
Full Text Sources
