. 2009 Nov;100(11):2115-25.
doi: 10.1111/j.1349-7006.2009.01282.x. Epub 2009 Jul 8.

BRCA2 interacts with the cytoskeletal linker protein plectin to form a complex controlling centrosome localization

Affiliations

BRCA2 interacts with the cytoskeletal linker protein plectin to form a complex controlling centrosome localization

Takayoshi Niwa et al. Cancer Sci. 2009 Nov.

Abstract

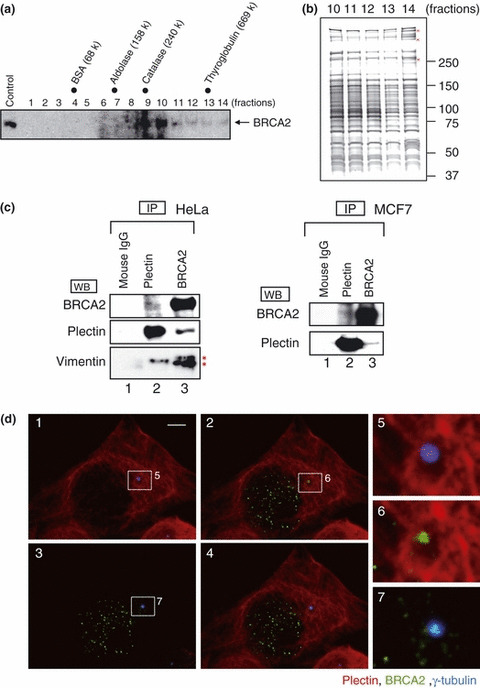
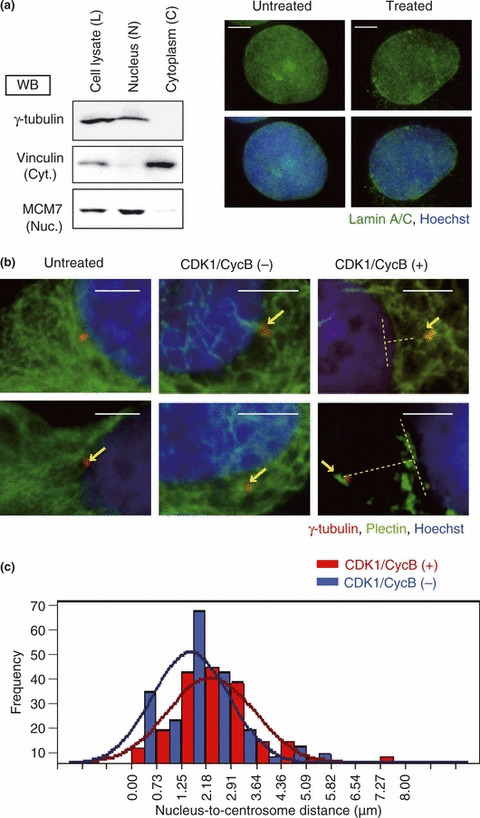
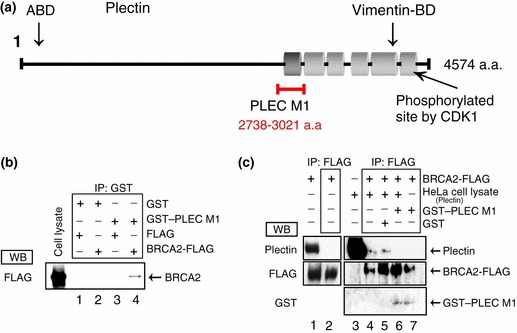
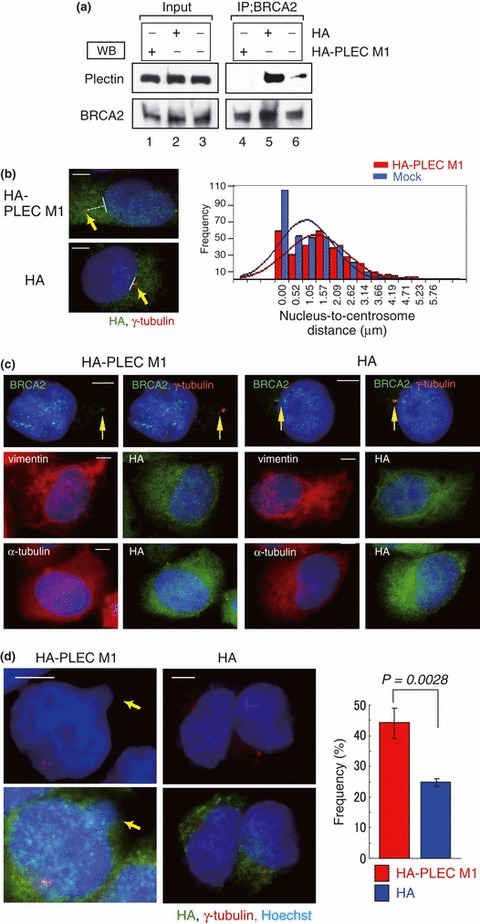
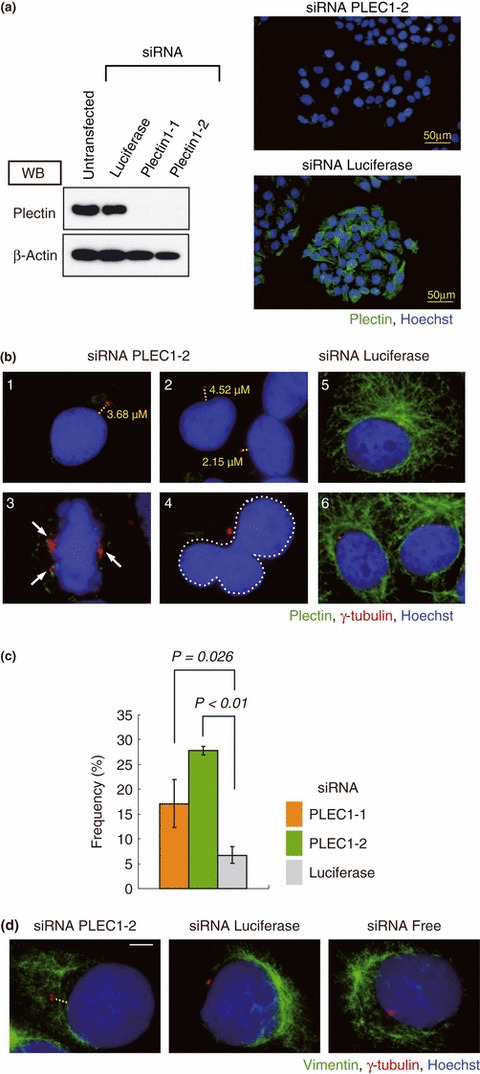
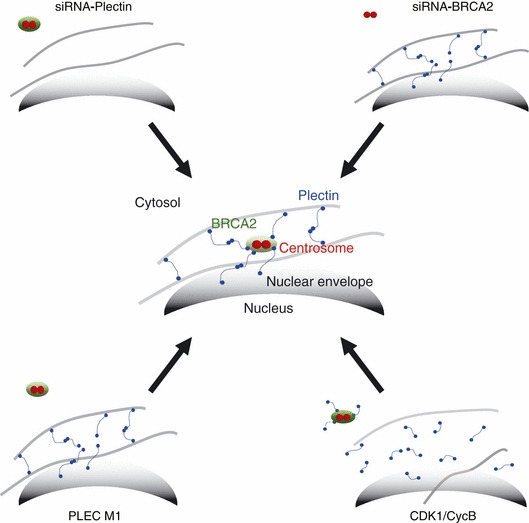
The breast cancer susceptibility gene (BRCA2) is localized mainly in the nucleus where it plays an important role in DNA damage repair. Some BRCA2 protein is also present in the centrosome. Here, we demonstrate that BRCA2 interacts with plectin, a cytoskeletal cross-linker protein, and that this interaction controls the position of the centrosome. Phosphorylation of plectin by cyclin-dependent kinase 1/cyclin B (CDK1/CycB) kinase has been reported to abolish its cross-linking function during mitosis. Here, we induced phosphorylation of plectin in prepared fractions of HeLa cells by adding activated CDK1/CycB kinase. Consequently, there was significant dissociation of the centrosome from the nuclear membrane. Plectin has six homologous ankyrin-like repeat domains (termed PLEC M1-M6). Using a pull-down assay, we found that GST-PLEC M1 and a GST-C-terminal region fusion protein (which comprised PLEC M6, along with an adjacent vimentin site) interacted with BRCA2. Since each PLEC module exhibits high homology to the others, the possibility of all six domains participating in this interaction was indicated. Moreover, when PLEC M1 was overexpressed in HeLa cells, it competed with endogenous plectin and inhibited the BRCA2-plectin interaction. This inhibitory effect resulted in dissociation of the centrosomes from the nucleus and increased the rate of micronuclei formation which may lead to carcinogenesis. In addition, when either BRCA2 or plectin was suppressed by the appropriate siRNA, a similar change in centrosomal positioning was observed. We suggest that the BRCA2-plectin interaction plays an important role in the regulation of centrosome localization and also that displacement of the centrosome may result in genomic instability and cancer development.


Figures

Figure 1
Figure 1
High molecular mass complex formation by the breast cancer susceptibility gene (BRCA2) and its association with plectin. (a) HeLa S3 cell extracts were separated by 15–30% glycerol gradient ultracentrifugation and the distribution of BRCA2 was examined by western blotting (lanes 1–14). Fraction numbers are indicated at the above of each panel. Molecular mass markers are indicated at the top of the figure. Arrows indicate the BRCA2 bands. (b) BRCA2‐associated proteins are present in a high molecular weight complex (lanes 11–14). Fractions (lanes 10–14) were separated by SDS‐PAGE and stained with silver‐ammoniac silver stain. Bands specifically present in lane 14 (red marks) were excised and the proteins identified by tandem mass spectrometry. (c) Coimmunoprecipitation of the endogenous BRCA2‐associated protein, plectin. A HeLa S3 extract (left panel) and MCF7 extract (right panel) were analyzed by immunoprecipitation, SDS‐PAGE, and western blotting using the indicated antibodies. Asterisks (*) indicate non‐specific bands originating from use of the anti‐BRCA2 antibody. (d) Immunostaining of BRCA2, γ‐tubulin, and plectin localization. HeLa S3 cells were incubated with anti‐BRCA2 antibody (Ab‐2; green), γ‐tubulin antibody (c‐20; blue), and plectin antibody (red). The boxed areas in 1, 2, and 3 are shown as magnified images in the row of images on the right (5–7). 1, γ‐tubulin (blue), plectin (red); 2, BRCA2 (green), plectin (red); 3, BRCA2 (green), γ‐tubulin (blue); 4, merged image. Scale bar, 5 μm.
Figure 2
Figure 2
Cyclin‐dependent kinase 1/cyclin B (CDK1/CycB) kinase caused a change in cytoskeletal structure and centrosome localization. (a) HeLa cells were fractionated into nuclear and cytoplasmic compartments. Cell lysate (L), nuclear fraction (N), and cytoplasmic fraction (C) from HeLa cells were analyzed by immunoblotting with antibodies against γ‐tubulin (centrosomal marker), vinculin (cytosolic protein marker), and MCM7 (nuclear protein marker). Untreated cells (left row) and the nuclear fraction (right row) stained with antibodies against lamin A/C (green) and with Hoechst 33258 (blue) were analyzed by fluorescence microscopy. Scale bar, 5 μm. Upper row, lamin A/C; lower row, lamin A/C and Hoechst 33258. (b) The nuclear fraction was treated with CDK1/CycB kinase. The two images on the left show the untreated cells, the middle two images show the CDK1/CycB (−) fractions, and the right two images show the CDK1/CycB (+) fraction. Samples were stained with antibodies against plectin (green), γ‐tubulin (red), and Hoechst 33258 (blue). Arrows indicate localization of the centrosome and dotted lines indicate the measured distance between the centrosome and nucleus. Scale bar, 5 μm. (c) Minimum distance between the nuclear edge and centrosome was measured using Adobe Photoshop CS3 software (Adobe, San Jose, CA, USA). Centrosomes overlying the nucleus were excluded from the analysis. Distances were measured in the CDK1/CycB kinase positive (+) and CDK1/CycB (−) groups (n =157 and 180, respectively, P =0.046).
Figure 3
Figure 3
PLEC M1 plays an important role in the breast cancer susceptibility gene (BRCA2)–plectin interaction. (a) Structurally, plectin consists of a ∼200‐nm central coiled‐coil rod flanked by globular N‐ and C‐terminal domains. The actin‐binding domain (ABD) is located close to the amino terminus. The structure of the C‐terminal domain is dominated by six highly homologous repeat domains comprising an intermediate filament (vimentin) binding domain and a cyclin‐dependent kinase phosphorylation site. Among these domains, we focused on PLEC M1 (2738–3021 amino acids). (b) GST–PLEC M1 and GST were incubated with BRCA2‐FLAG or FLAG, and a pull‐down assay was then performed. Lane 1, GST incubated with FLAG; lane 2, GST incubated with BRCA2‐FLAG; lane 3, GST–PLEC M1 incubated with FLAG; lane 4, GST–PLEC M1 incubated with BRCA2‐FLAG. (c) HeLa S3 cell lysate was incubated with BRCA2‐FLAG. BRCA2‐FLAG was overexpressed transiently in COS7 cells. Cell lysates of these COS7 cells were subjected to immunoprecipitation with anti‐FLAG antibody followed by western blotting with the corresponding antibodies (left panel). GST–PLEC M1 or GST was added and samples were subjected to immunoprecipitation with anti‐FLAG antibody followed by western blotting with the corresponding antibodies (right panel). GST–PLEC M1 and GST were purified and checked for quantity on a CBB‐stained SDS‐PAGE gel (not shown).
Figure 4
Figure 4
Subcellular localization of the centrosome in HeLa S3 cells transfected or untransfected with HA‐PLEC M1. (a) HA‐PLEC M1 was expressed transiently in HeLa S3 cells (lanes 1 and 4). HA‐transfected cells (lanes 2 and 5). Untransfected cells (lanes 3 and 6). Western blotting of cell lysates (input, left panel) and immunoprecipitation with anti‐breast cancer susceptibility gene (BRCA2) antibody (right panel) were performed using anti‐plectin or anti‐BRCA2 antibodies. Endogenous BRCA2 interacted with endogenous plectin in HeLa S3 cells (lane 5); however, endogenous BRCA2 did not interact with endogenous plectin in HA‐PLEC M1‐transfected cells (lane 4). (b) Indirect immunofluorescent staining with antibodies against HA (green) and γ‐tubulin (red) and with Hoechst 33258 (blue). In the HA‐PLEC M1‐transfected cells (left upper panel), displacement of centrosomes was observed. In the HA‐transfected cells (left lower panel), no comparable change in centrosome location was observed. Arrows indicate centrosomes. Bar, 5 μm. Minimum distance between the nuclear edge and centrosome was measured using Adobe Photoshop CS3 software. Distances were measured in HA‐PLEC M1‐transfected cells and HA‐transfected cells (n =293 and 348, respectively; P =0.018) (right panel). (c) Indirect immunofluorescent staining with antibodies against BRCA2 (green) and γ‐tubulin (red) (upper), with antibodies against HA (green) and vimentin (red) (middle), with antibodies against HA (green) and α‐tubulin (red) (lower). Nucleus stained with Hoechst 33258 (blue). (d) The numbers of abnormal nuclei were counted in HA‐PLEC M1‐transfected cells or HA‐transfected cells. The panels on the left show the HA‐PLEC M1‐transfected cells, with the panels on the right showing the HA‐transfected cells. Arrow indicates micronuclei, with the margin of the nucleus was indicated by a dotted line. Experiments were performed in triplicate; the histogram shows the mean frequencies (± SD) of abnormal nuclei in three independent experiments. The mean frequency of abnormal nuclei was 44.3% for HA‐PLEC M1‐transfected cells (red, n =287) and 25% for HA‐transfected cells (blue, n =288).
Figure 5
Figure 5
Suppression of plectin causes serious damage to the cell. (a) HeLa cells were transfected with control siRNA or with plectin siRNA (PLEC1‐1, ‐2), and 48 h after transfection, cells were harvested and subjected to immunoblotting with antibodies against plectin and β‐actin. Non‐transfected cells were also subjected to the same immunoblotting process. PLEC1‐1‐ and 1‐2‐transfected cells exhibited markedly reduced plectin expression; consequently, these siRNAs were selected for use in all the subsequent experiments. Immunofluorescence microscopy of PLEC1‐2 siRNA (right upper panel) and luciferase siRNA (right lower panel) transfected cells is shown. Bars, 50 μm. (b) Immunostaining with antibodies against plectin (green), γ‐tubulin (red), and with Hoechst 33258 (blue). PLEC 1‐2 siRNA‐transfected cells (1–4) and control siRNA (5 and 6). Measured distances between centrosome and nucleus are indicated. Arrows indicate centrosomes. The margin of the aberrant nucleus is indicated by a dotted line in picture 4. (c) The histogram shows the mean frequencies (± SD) of nuclear anomalies and centrosomal displacement in three independent experiments. Two people independently counted cells that displayed a nuclear abnormality. The mean values for PLEC1‐1, PLEC1‐2, and luciferase transfected cells were 17.1%, 27.9%, and 6.7%, respectively. (d) Immunostaining with antibodies against vimentin (green), γ‐tubulin (red), and with Hoechst 33258 (blue). PLEC 1‐2 siRNA‐transfected cells (left), luciferase siRNA‐transfected cells (middle), and siRNA free cells (right).
Figure 6
Figure 6
Model for centrosome localization at the nucleus. Plectin (blue) and the breast cancer susceptibility gene (BRCA2) (green) interact directly, and the complexes thus formed attach to intermediate filaments (gray lines). The cytoskeletal intermediate filaments are connected to the nuclear membrane by plectin and nesprin‐3. The centrosomes localize around the nucleus by attaching to the cytoskeletal protein through the plectin–BRCA2 complex. Thus, the centrosome is indirectly anchored to the nucleus.

References

    1. Wooster R, Bignell G, Lancaster J et al. Identification of the breast cancer susceptibility gene BRCA2. Nature 1995; 378: 789–92. - PubMed
    1. Venkitaraman A. Cancer susceptibility and the functions of BRCA1 and BRCA2. Cell 2002; 108: 171–82. - PubMed
    1. Pellegrini L, Venkitaraman A. Emerging functions of BRCA2 in DNA recombination. Trends Biochem Sci 2004; 29: 310–6. - PubMed
    1. Esashi F, Christ N, Gannon J et al. CDK‐dependent phosphorylation of BRCA2 as a regulatory mechanism for recombinational repair. Nature 2005; 434: 598–604. - PubMed
    1. Wong A, Pero R, Ormonde P, Tavtigian S, Bartel P. RAD51 interacts with the evolutionarily conserved BRC motifs in the human breast cancer susceptibility gene brca2. J Biol Chem 1997; 272: 31941–4. - PubMed

Publication types