Comparative Study
. 2009 Aug 27;63(4):497-507.
doi: 10.1016/j.neuron.2009.07.027.

Hippocampal replay of extended experience

Affiliations
Comparative Study

Hippocampal replay of extended experience

Thomas J Davidson et al. Neuron. .

Abstract

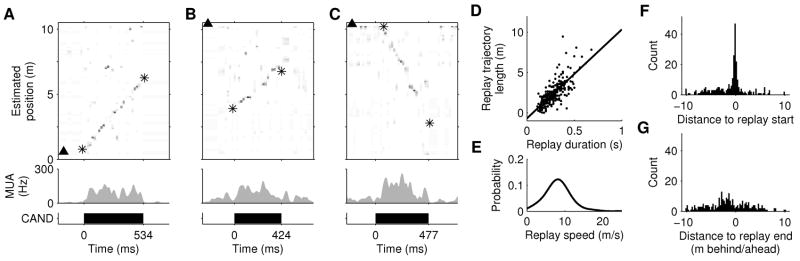
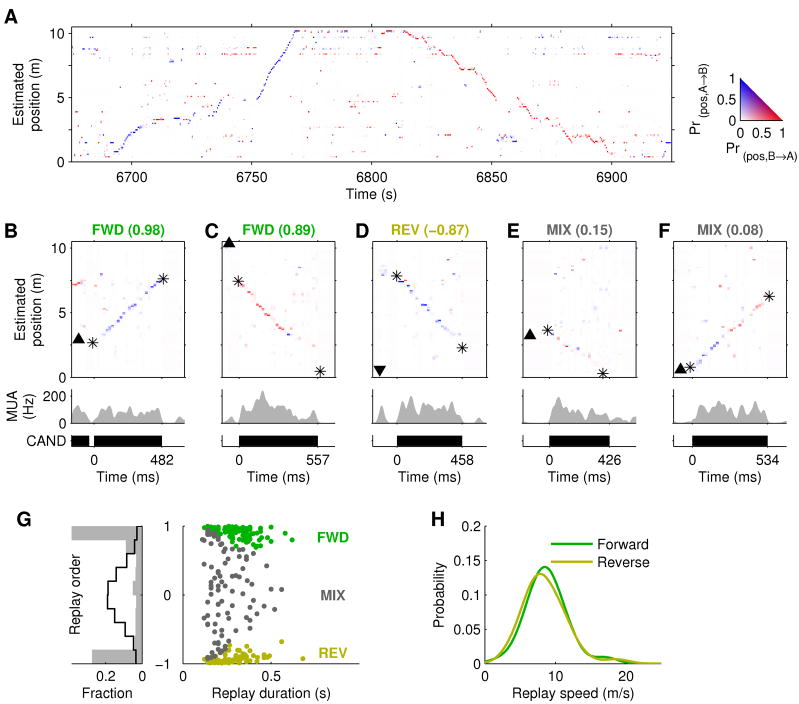
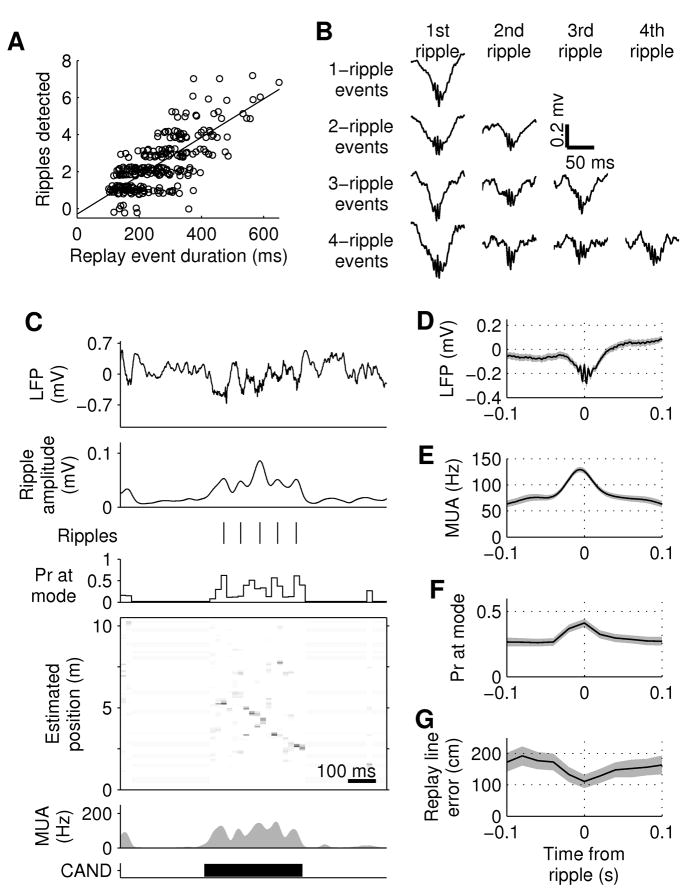
During pauses in exploration, ensembles of place cells in the rat hippocampus re-express firing sequences corresponding to recent spatial experience. Such "replay" co-occurs with ripple events: short-lasting (approximately 50-120 ms), high-frequency (approximately 200 Hz) oscillations that are associated with increased hippocampal-cortical communication. In previous studies, rats exploring small environments showed replay anchored to the rat's current location and compressed in time into a single ripple event. Here, we show, using a neural decoding approach, that firing sequences corresponding to long runs through a large environment are replayed with high fidelity and that such replay can begin at remote locations on the track. Extended replay proceeds at a characteristic virtual speed of approximately 8 m/s and remains coherent across trains of ripple events. These results suggest that extended replay is composed of chains of shorter subsequences, which may reflect a strategy for the storage and flexible expression of memories of prolonged experience.


Figures

Figure 1
Figure 1. Behavior and candidate replay events
A, Top view of the 10.3 m-long track. Rat visible at right. B, Head position during 100 seconds of exploration. Labels ‘A’ and ‘B’ denote the 2 ends of the track as used throughout the paper. C, Linearized position (meters from ‘A’); same data as (B). D, Multi-unit activity (MUA) across all electrodes. Note distinct peaks corresponding to elevated population activity. E, Identified periods of RUN (>15 cm/s), STOP (<5 cm/s), and candidate replay events (CAND; extracted from the MUA in D). F, Histogram of candidate event durations in all rats. G,H, Average MUA aligned to start (G) and end (H) of long (>250 ms) candidate events for rat 1. Note steep onset and offset of events.
Figure 2
Figure 2. Replay detection using position reconstruction
A–E, Behavior and position reconstruction for a 80-second epoch during which rat 1 runs approximately 7 m (from 10.3m to 3.5m), while pausing frequently. A, True position of animal. B, Estimated position. Each column is a probability density function estimated from unit activity in a 500 ms window. (White: p=0; black: p=1). C, Raster plots of spike times. Units are ranked by their preferred firing location; unit 1 has a place field closest to 0 m. Note bursts at 17 s, 27 s, and 78 s, which recruit a large fraction of all units. D, Multi-unit activity (MUA; average spike rate per tetrode, including unclustered spikes). E, Identified periods of RUN and STOP and candidate replay events (CAND). F–I, Position reconstruction applied to a candidate event revealing extended replay. F, Estimated position (20 ms bins) describes a trajectory from 8 m to 2 m while the animal remains stationary at 9 m (black arrowhead). The direction of the arrowhead indicates that the animal is facing in the B→A direction. G, Raster plot of unit firing. H, MUA. I, Candidate event. This event is the third example shown in Supplementary Movie 2.
Figure 3
Figure 3. Extended replay
A–C, Examples of extended replay from rats 1–3. Top: Estimated position (asterisks indicate start/end of detected linear trajectory). Middle: MUA. Bottom: extent of replay event. D, Length of replayed trajectory vs. event duration for all replays. Solid line: linear regression (slope = 11.1 m/s; R2 = 0.59; p<10−10). E, Kernel density estimate (Gaussian kernel, width = 1.5 m/s) of the distribution of replay speeds. F–G, Distribution of start (F) and end (G) locations of replay trajectories relative to the animal’s position and heading on the track. A negative distance indicates the replayed trajectory starts or ends behind the animal (along the track).
Figure 4
Figure 4. Forward and reverse extended replay
A, Joint reconstruction of position and running direction (500 ms bins). Color indicates estimated running direction (see inset). Direction is correctly estimated for both the A→B (6750–6770 s) and B→A directions (6820–6850 s). B–F, Examples of forward (FWD), reverse (REV), and mixed (MIX) replay from rat 1, each labeled with its replay order score. The events in (B) and (C) are the first 2 examples shown in Supplementary Movie 2. Top: Joint position and direction estimates (20 ms bins). Arrowhead indicates animal’s position and facing direction. Asterisks indicate start and end of detected replay trajectory. Middle: Multi-unit activity. Bottom: extent of replay event. B, Forward replay in the A→B direction proceeding ahead of the animal. C, Forward replay in the B→A direction, starting 2 m behind the animal and proceeding behind the animal. D, Reverse replay, starting remotely and proceeding towards the animal. Trajectory is similar to (C), but this is a reverse-ordered replay because the estimated running direction (i.e. A→B (blue)) does not agree with the direction in which the replay proceeds (i.e. from B→A). E, Mixed replay proceeding behind the animal. F, Mixed replay proceeding ahead of the animal. This event begins as an apparently forward-ordered replay then switches to reverse-ordered after ~240 ms. G, Left: distribution of observed (gray bars) and expected (pseudo-event shuffles; black line) replay order scores. Right: scatter plot of replay order score and replay duration for all significant replay events in all animals. green: forward replay; yellow: reverse replay; gray: mixed replay. H, Kernel density estimates (Gaussian kernel, width = 1.5 m/s) of the distribution of replay speeds for forward and reverse replay.
Figure 5
Figure 5. Replay spans multiple ripples
A, Scatter plot of number of detected ripples during significant replay events in all animals as a function of replay event duration. Random jitter added in y-axis for visualization. Linear regression: 9.9 ripples/s, R2 = 0.56. B, Ripple-triggered averages of wide-band hippocampal local field potential (LFP) during replay events in rat 1. Even in multiple-ripple events, each ripple is associated with a sharp wave in the LFP. C, Example of multiple ripples during a single extended replay event. From top to bottom: LFP; average amplitude in the ripple band (150–250 Hz) across all electrodes; detected ripples; probability at the mode of position estimate; position estimate; MUA; candidate event time. D–G, Ripple-triggered averages of: wide band LFP (D), MUA (E), mode of position estimate (F), and error between estimated location and replay trajectory (G) for replay events in rat 1. Shaded regions: 95% confidence intervals for the mean.

Comment in

References

    1. August DA, Levy WB. Temporal sequence compression by an integrate-and-fire model of hippocampal area CA3. J Comput Neurosci. 1999;6:71–90. - PubMed
    1. Battaglia FP, Sutherland GR, McNaughton BL. Hippocampal sharp wave bursts coincide with neocortical “up-state” transitions. Learn Mem. 2004;11:697–704. - PMC - PubMed
    1. Brown EN, Frank LM, Tang D, Quirk MC, Wilson MA. A statistical paradigm for neural spike train decoding applied to position prediction from ensemble firing patterns of rat hippocampal place cells. J Neurosci. 1998;18:7411–7425. - PMC - PubMed
    1. Buckner RL, Carroll DC. Self-projection and the brain. Trends Cogn Sci. 2007;11:49–57. - PubMed
    1. Buzsaki G. Two-stage model of memory trace formation: a role for “noisy” brain states. Neuroscience. 1989;31:551–570. - PubMed

Publication types