Comparative Study
. 2009 Aug 27;63(4):544-57.
doi: 10.1016/j.neuron.2009.07.018.

Generating coherent patterns of activity from chaotic neural networks

Affiliations
Comparative Study

Generating coherent patterns of activity from chaotic neural networks

David Sussillo et al. Neuron. .

Abstract

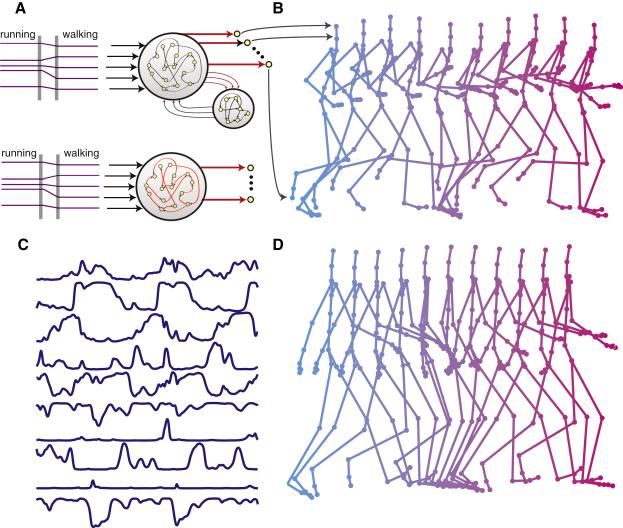
Neural circuits display complex activity patterns both spontaneously and when responding to a stimulus or generating a motor output. How are these two forms of activity related? We develop a procedure called FORCE learning for modifying synaptic strengths either external to or within a model neural network to change chaotic spontaneous activity into a wide variety of desired activity patterns. FORCE learning works even though the networks we train are spontaneously chaotic and we leave feedback loops intact and unclamped during learning. Using this approach, we construct networks that produce a wide variety of complex output patterns, input-output transformations that require memory, multiple outputs that can be switched by control inputs, and motor patterns matching human motion capture data. Our results reproduce data on premovement activity in motor and premotor cortex, and suggest that synaptic plasticity may be a more rapid and powerful modulator of network activity than generally appreciated.


Figures

Figure 1
Figure 1
Network architectures. In all three cases, a recurrent generator network with firing rates r drives a linear readout unit with output z through weights w (red) that are modified during training. Only connections shown in red are subject to modification. A) Feedback to the generator network (large network circle) is provided by the readout unit. B) Feedback to the generator network is provided by a separate feedback network (smaller network circle). Neurons of the feedback network are recurrently connected and receive input from the generator network through synapses of strength JFG (red), which are modified during training. C) A network with no external feedback. Instead, feedback is generated within the network and modified by applying FORCE learning to the synapses with strengths JGG internal to the network (red).
Figure 2
Figure 2
FORCE learning in the network of figure 1A. A-C) The FORCE training sequence. Network output, z, is in red, the firing rates of 10 sample neurons from the network are in blue and the orange trace is the magnitude of the time derivative of the readout weight vector. A) Before learning, network activity and output are chaotic. B) During learning, the output matches the target function, in this case a triangle wave and the network activity is periodic because the readout weights fluctuate rapidly. These fluctuations subside as learning progresses. C) After training, the network activity is periodic and the output matches the target without requiring any weight modification. D-K) Examples of FORCE Learning. Red traces are network outputs after training with the network running autonomously. Green traces, where not covered by the matching red traces, are target functions. D) Periodic function composed of 4 sinusoids. E) Periodic function composed of 16 sinusoids. F) Periodic function of 4 sinusoids learned from a noisy target function. G) Square-wave. H) The Lorenz attractor. Initial conditions of the network and the target were matched at the beginning of the traces. I) Sine waves with periods of 60 ms and 8 s. J) A one-shot example using a network with two readout units (circuit insert). The red trace is the output of unit 2. When unit 1 is activated, its feedback creates the fixed point to the left of the left-most blue arrow, establishing the appropriate initial condition. Feedback from unit 2 then produces the sequence between the two blue arrows. When the sequence is concluded, the network output returns to being chaotic. K) A low amplitude sine wave (right of gray line) for which the FORCE procedure does not control network chaos (blue traces) and learning fails.
Figure 3
Figure 3
Principal component analysis of network activity. A) Output after training a network to produce a sum of four sinusoids (red), and the approximation (brown) obtained using activity projected onto the 8 leading principal components. B) Projections of network activity onto the leading eight PC vectors. C) PCA eigenvalues for the network activity that generated the waveform in A. Only the largest 100 of 1000 eigenvalues are shown. D) Schematic showing the transition from control to learning phases of learning as a function of time and of PC eigenvalue. E) Evolution of the projections of w onto the two leading PC vectors during learning starting from five different initial conditions. These values converge to the same point on all trials. F) The same weight evolution but now including the projection onto PC vector 80 as a third dimension. The final values of this projection are different on each of the 5 runs, resulting in the vertical line at the center of the figure. Nevertheless, all of these networks generate the output in A.
Figure 4
Figure 4
Comparison of different mixtures of FORCE (γ = 0 and echo-state (γ =1) feedback. A) Percent of trials resulting in stable generation of the target function. B) Mean absolute error (MAE) between the output and target function after learning over the γ range where learning converged. C) Example run with output (red) and target function (green) for γ =1. The trajectory is unstable.
Figure 5
Figure 5
Chaos improves training performance. Networks with different g values (Methods) were trained to produce the output of figure 3A. Results are plotted against g in the range 0.75 < g <1.56, where learning converged. A) Number of cycles of the periodic target function required for training. B) The RMS error of the network output after training. C) The length of the readout weight vector |w| after training.
Figure 6
Figure 6
Feedback variants. A) Network trained to produce a periodic output (red trace) when its feedback (cyan trace) is 1.3tanh(sin(πz(t -100 ms)), a delayed and distorted function of the output z(t) (gray oval in circuit diagram). B) FORCE learning with a separate feedback network (circuit diagram). Output is the red trace, and blue traces show activity traces from 5 neurons within the feedback network. C) A network (circuit diagram) in which the internal synapses are trained to produce the output (red). Activities of 5 representative network neurons are in blue. The thick cyan traces are overlays of the component of the input to each of these 5 neurons induced by FORCE learning, j(Jij(t)Jij(0))rj(t) for i=1K 5.
Figure 7
Figure 7
Multiple pattern generation and 4-Bit memory through learning in the generator network. A) Network with control inputs used to produce multiple output patterns (synapses and readout weights that are modifiable in red). B) Five outputs (1 cycle of each periodic function made from 3 sinusoids is shown) generated by a single network and selected by static control inputs. C) A network with 4 outputs and 8 inputs used to produce a 4-bit memory (modifiable synapses and readout weights in red). D) Red traces are the 4 outputs, with green traces showing their target values. Purple traces show the 8 inputs, divided into ON and OFF pairs associated with the output trace above them. The upper input in each pair turns the corresponding output on (sets it to +1). The lower input of each pair turns the output off (sets it to -1). After learning, the network has implemented a 4-bit memory, with each output responding only to its two inputs while ignoring the other inputs.
Figure 8
Figure 8
Networks that generate both running and walking human motions. A) Either of these two network architectures can be used to generate the running and walking motions (modifiable readout weights shown in red), but the upper network is shown. Constant inputs differentiate between running and walking (purple). Each of 95 joint angles is generated through time by one of the 95 readout units (curved arrows). B) The running motion generated after training. Cyan frames show early and magenta frames late movement phases. C) Ten sample network neuron activities during the walking motion. D) The walking motion, with colors as in B.

Comment in

References

    1. Abarbanel HD, Creveling DR, Jeanne JM. Estimation of parameters in nonlinear systems using balanced synchronization. Phys. Rev. E Stat. Nonlin. Soft. Matter Phys. 2008;77:016208. - PubMed
    1. Atiya AF, Parlos AG. New results on recurrent network training: Unifying the algorithms and accelerating convergence. IEEE Transactions on Neural Networks. 2000;11:697–709. - PubMed
    1. Amit DJ, Brunel N. Model of global spontaneous activity and local structured activity during delay periods in the cerebral cortex. Cereb. Cortex. 1997;7:237–252. - PubMed
    1. Bertchinger N, Natschläger T. Real-time computation at the edge of chaos in recurrent neural networks. Neural Comput. 2004;16:1413–1436. - PubMed
    1. Brunel N. Dynamics of networks of randomly connected excitatory and inhibitory spiking neurons. J. Physiol. Paris. 2000;94:445–463. - PubMed

Publication types

MeSH terms