. 2009 Dec;21(12):1874-84.
doi: 10.1016/j.cellsig.2009.08.003. Epub 2009 Aug 23.

Lysophosphatidic acid-induced arterial wall remodeling: requirement of PPARgamma but not LPA1 or LPA2 GPCR

Affiliations

Lysophosphatidic acid-induced arterial wall remodeling: requirement of PPARgamma but not LPA1 or LPA2 GPCR

Yunhui Cheng et al. Cell Signal. 2009 Dec.

Abstract

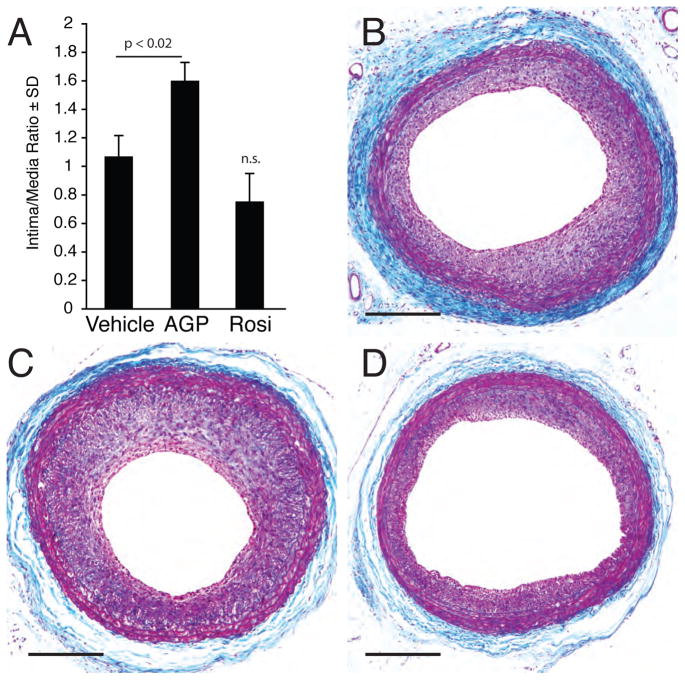
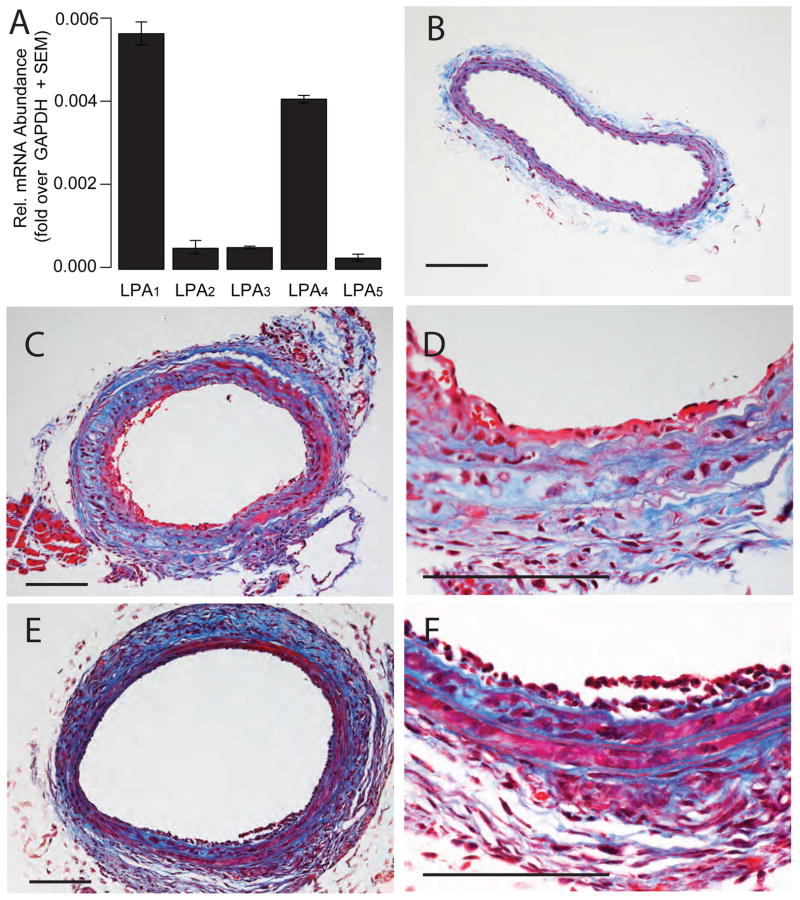
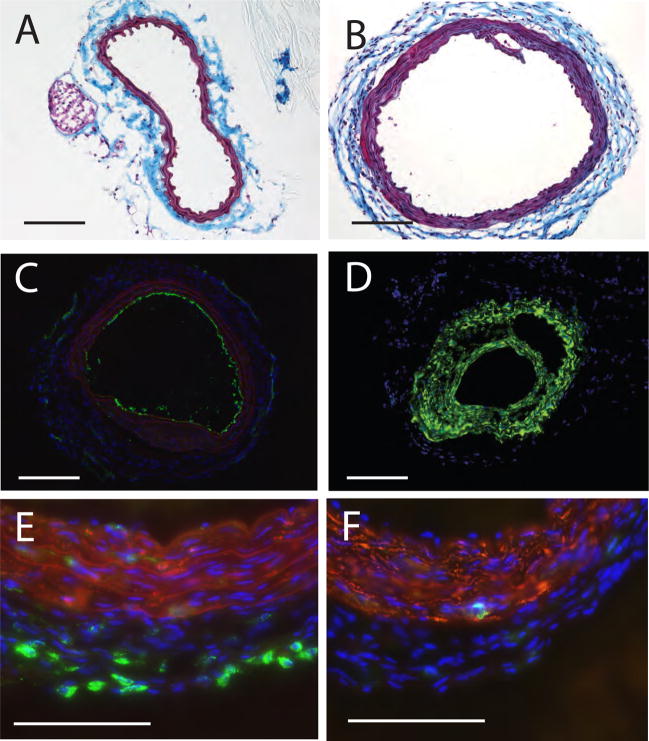
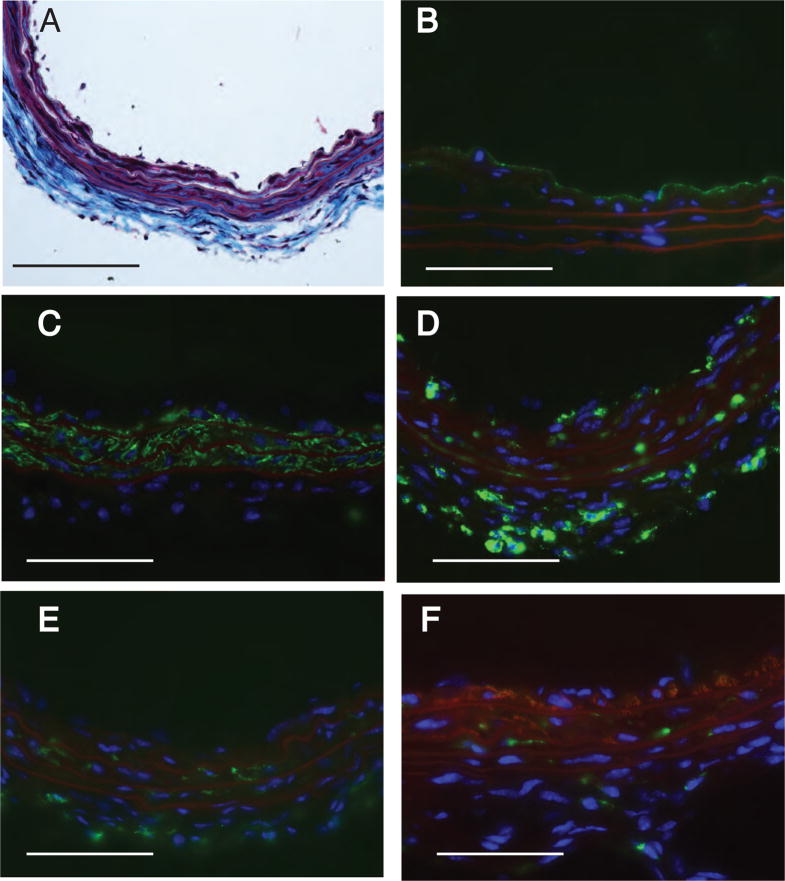
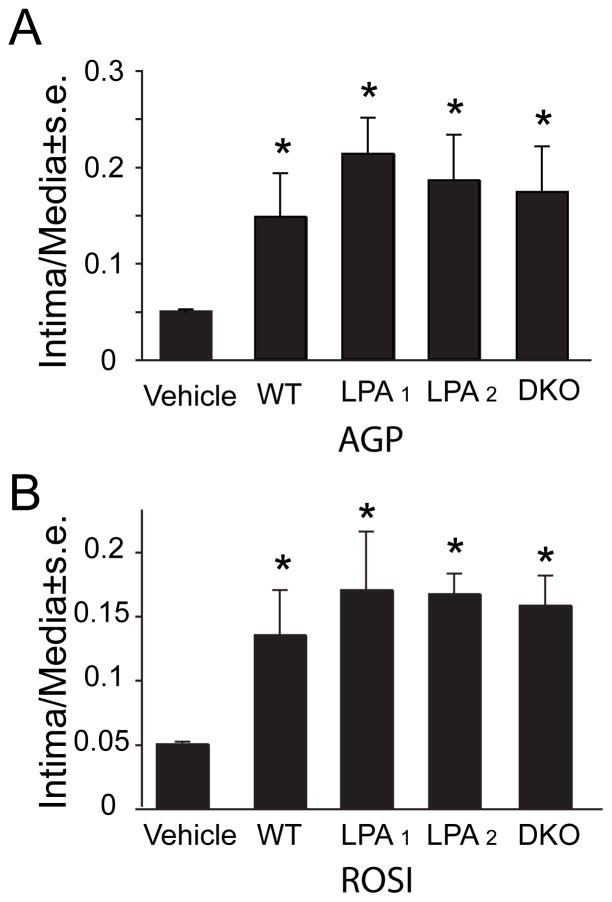
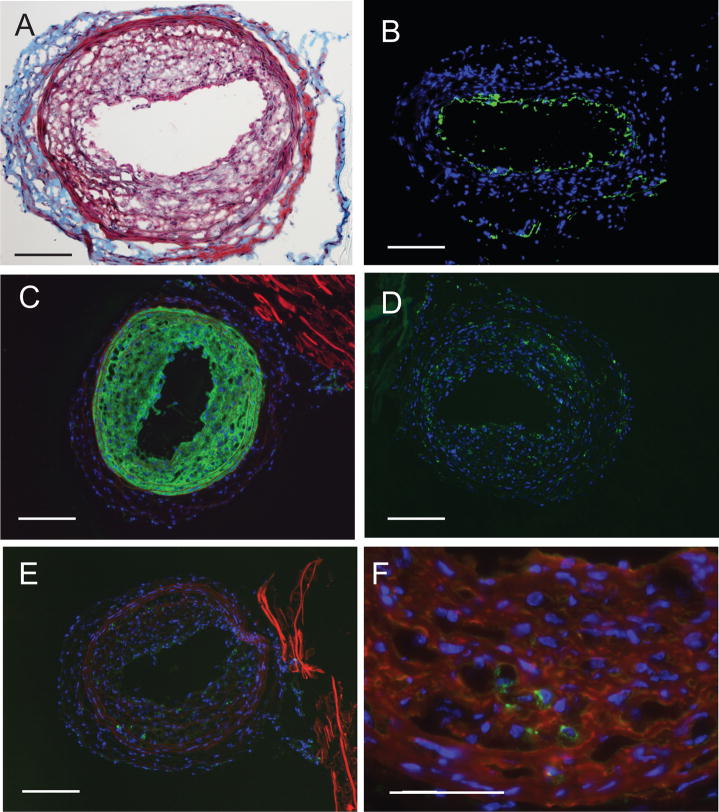
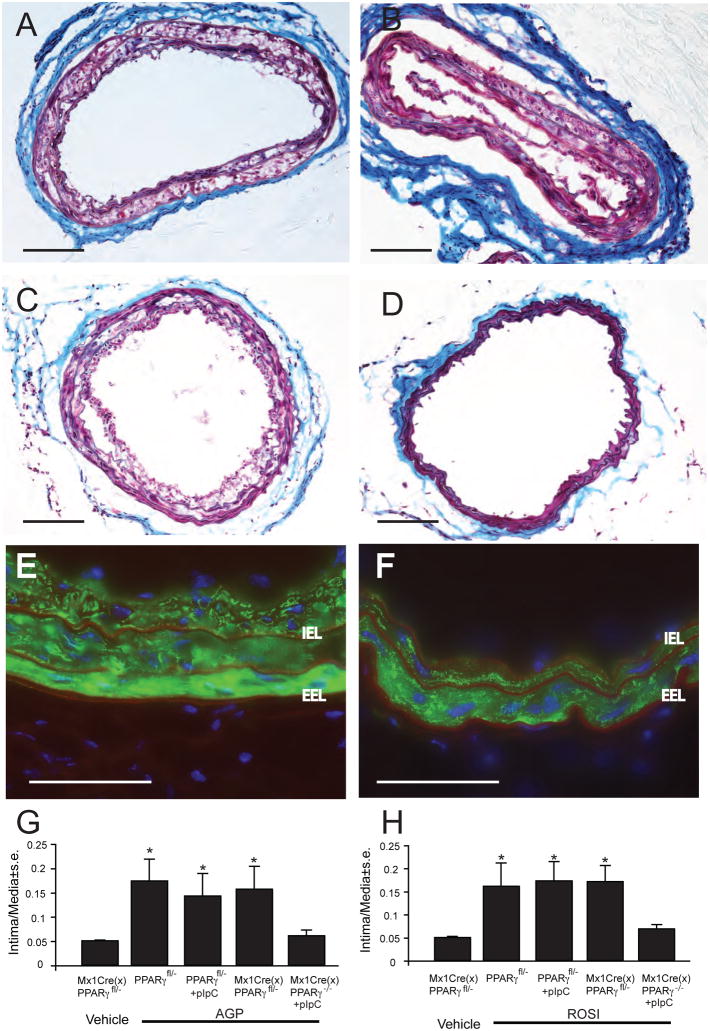
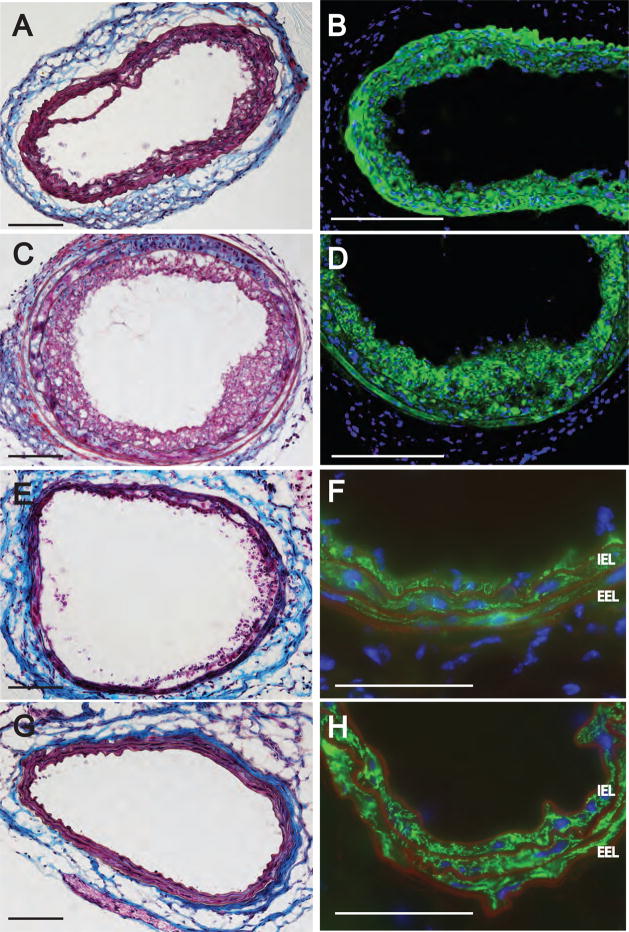
Lysophosphatidic acid (LPA) and its ether analog alkyl-glycerophosphate (AGP) elicit arterial wall remodeling when applied intralumenally into the uninjured carotid artery. LPA is the ligand of eight GPCRs and the peroxisome proliferator-activated receptor gamma (PPARgamma). We pursued a gene knockout strategy to identify the LPA receptor subtypes necessary for the neointimal response in a non-injury model of carotid remodeling and also compared the effects of AGP and the PPARgamma agonist rosiglitazone (ROSI) on balloon injury-elicited neointima development. In the balloon injury model AGP significantly increased neointima; however, rosiglitazone application attenuated it. AGP and ROSI were also applied intralumenally for 1h without injury into the carotid arteries of LPA(1), LPA(2), LPA(1&2) double knockout, and Mx1Cre-inducible conditional PPARgamma knockout mice targeted to vascular smooth muscle cells, macrophages, and endothelial cells. The neointima was quantified and also stained for CD31, CD68, CD11b, and alpha-smooth muscle actin markers. In LPA(1), LPA(2), LPA(1&2) GPCR knockout, Mx1Cre transgenic, PPARgamma(fl/-), and uninduced Mx1CrexPPARgamma(fl/-) mice AGP- and ROSI-elicited neointima was indistinguishable in its progression and cytological features from that of WT C57BL/6 mice. In PPARgamma(-/-) knockout mice, generated by activation of Mx1Cre-mediated recombination, AGP and ROSI failed to elicit neointima and vascular wall remodeling. Our findings point to a difference in the effects of AGP and ROSI between the balloon injury- and the non-injury chemically-induced neointima. The present data provide genetic evidence for the requirement of PPARgamma in AGP- and ROSI-elicited neointimal thickening in the non-injury model and reveal that the overwhelming majority of the cells in the neointimal layer express alpha-smooth muscle actin.


Figures

Figure 1
Figure 1
Effects of 10 μM AGP or ROSI on neointima induced by balloon injury of the rat carotid artery. Panel A: Intima-to-media ratios three weeks after balloon injury followed by a one-hour treatment with vehicle, 10 μM AGP or ROSI. Panels B, C, and D show representative cross sections of vehicle-, AGP-, and ROSI-treated carotid arteries. The calibration bar is 200 μm.
Figure 2
Figure 2
AGP and ROSI elicit arterial wall remodeling in C57/BL6 mouse carotids. Panel A: Quantitative RT-PCR of LPA GPCR expression in the mouse carotid artery. Panel B: Trichrome-stained cross section of a C57/BL6 mouse carotid treated with vehicle. Panels C & D: Cross section of a trichrome stained mouse common carotid artery three weeks after intralumenal application of 2.5 μM AGP. Panel C: Cross section of a mouse common carotid artery three weeks after intralumenal application of 2.5 μM ROSI. Trichrome staining, the bars are 100 μm. Note the multi-layered neointima and changes in the media indicated by the blue stain.
Figure 3
Figure 3
Histological and immunohistological staining of neointima in C57/BL6 mouse carotids three weeks after intralumenal application of 2.5 μM AGP. Panel A. Vehicle injected control carotid artery shows no neointima. Panel B: AGP-treatment causes concentric neointima with capillary formation within the neointima. Panel C: Anti-CD31 staining shows single layer of staining and lack of staining in the neointimal layers. Panel D. Anti-αSMA staining shows intensive immunoreactivity in the neointimal layers. Panel E. Merged image of anti-CD68 (green) and anti-αSMA (red) staining shows scattered cells bearing this marker in the neointima and no double stained cells in this merged image. Panel F. Anti-CD11b stained cells are few and anti-αSMA double positive cells are not visible. Calibration bar is 100 μm.
Figure 4
Figure 4
Histological and immunohistological staining of neointima three weeks after intralumenal application of 2.5 μM ROSI into the carotid of WT C57BL/6 mice. Panel A. Masson’s trichrome stain shows multi-layered neointima. Panel B: Anti-CD31 staining shows lack of staining in the neointimal layers. Panel C. Anti-αSMA staining shows intensive positivity of the neointimal layers. Panel D. Anti-CD68 stains cells bearing this marker in the neointima and at the media-adventitia boundary. Panel E. No anti-CD11b stained cells are detected in the neointima. Panel F. Merged image of double staining with anti-CD11b (green) and anti-αSMA (red) shows distinct populations of cells bearing only one but not both markers. Calibration bar is 100 μm.
Figure 5
Figure 5
Intima-to-media ratios measured in WT and LPA1, LPA2, and DKO mice. Effect of 2.5 μM intralumenal application of either AGP (panel A) or ROSI (panel B) three weeks after treatment. Note the similar intima-to-media ratios elicited by the treatments regardless of the genotype of the mice. No statistically significant differences were found between the different KOs.
Figure 6
Figure 6
Immunohistological phenotyping of neointima three weeks after intralumenal application of 5 μM AGP in DKO mice. Panel A: Masson trichrome-stained carotid shows multi-layered neointima. Panel B: Anti-CD31 staining shows lack of staining in the neointimal layers. Panel C. Anti-αSMA staining shows intensive immunoreactivity in the neointimal layers. Panel D. Anti-CD68 staining shows positive cells in the neointima. Panel E. Anti-CD11b stained cells are few and localized at the media-to-adventitia border. Panel F: Merged double staining for CD11n (green) and anti-αSMA staining shows no double positive cell. Calibration bar is 100 μm.
Figure 7
Figure 7
Effect of Mx1Cre-mediated conditional knock out of PPARγ on AGP-induced neointima. Panel A: Trichrome staining of a representative Mx1Cre transgenic mouse carotid three weeks after exposure to 2.5 μM AGP. Panel B: Representative trichrome-stained carotid of a pIpC-induced PPARγfl/− mouse three weeks after AGP treatment. Panel C: Trichrome-stained mouse carotid from a Mx1CreXPPARγfl/− mouse without pIpC induction three weeks after exposure to 2.5 μM AGP. Panel D: Trichrome-stained carotid from a pIpC-induced ΔPPARγ mouse three weeks after AGP treatment. Note the complete lack of neointima development. Panel E: Anti-αSMA staining of an uninduced Mx1CreXPPARγfl/− mouse three weeks after AGP treatment. Note the αSMA positive neointimal cells inside the internal elastic lamina (IEL) that shows red autofluorescence. EEL- external elastic lamina. Panel F: Anti-αSMA staining of an pIpC-induced ΔPPARγ mouse three weeks after AGP treatment. Note the complete lack of αSMA staining inside the IEL. Calibartion bars are 100 μm. Intima to media ratios in mice with or without pIpC induction three weeks after exposure to 2.5 μm AGP (panel G) or ROSI (panel H). Asterisks denote significant differences to uninduced vehicle-treated Mx1CreXPPARγfl/− mice (p< 0.05, n= 5–10 mouse per group).
Figure 8
Figure 8
Effect of Mx1Cre-mediated conditional knock out of PPARγ on ROSI-induced neointima. Trichrome (panel A) and anti-αSMA (panel B) staining of a pIpC-treated Mx1Cre mouse carotid three weeks after treatment with 2.5 μM ROSI. Trichorme (panel C) and anti-αSMA (panel D) staining of a carotid from a pIpC-induced PPARγfl/− mouse. Trichorme (panel E) and anti-αSMA (panel F) staining of a carotid from a non-pIpC-induced Mx1CreXPPARγfl/− mouse carotid. Note the anti-αSMA positive neointimal cells inside the IEL. Trichorme (panel G) and anti-αSMA (panel H) staining of an pIpC-induced ΔPPARγ mouse three weeks after ROSI treatment. Note the complete lack of αSMA staining inside the IEL. Calibartion bars are 100 μm.

References

    1. Siess W, Tigyi G. J Cell Biochem. 2004;92(6):1086–1094. - PubMed
    1. McIntyre TM, Pontsler AV, Silva AR, St Hilaire A, Xu Y, Hinshaw JC, Zimmerman GA, Hama K, Aoki J, Arai H, Prestwich GD. Proc Natl Acad Sci U S A. 2003;100(1):131–136. - PMC - PubMed
    1. Tsukahara T, Tsukahara R, Yasuda S, Makarova N, Valentine WJ, Allison P, Yuan H, Baker DL, Li Z, Bittman R, Parrill A, Tigyi G. J Biol Chem. 2006;281(6):3398–3407. - PubMed
    1. Xiao YJ, Schwartz B, Washington M, Kennedy A, Webster K, Belinson J, Xu Y. Anal Biochem. 2001;290(2):302–313. - PubMed
    1. Rother E, Brandl R, Baker DL, Goyal P, Gebhard H, Tigyi G, Siess W. Circulation. 2003;108(6):741–747. - PubMed

Publication types

MeSH terms