. 2010 Feb;29(2):350-64.
doi: 10.1109/TMI.2009.2030799. Epub 2009 Aug 25.

4-D cardiac MR image analysis: left and right ventricular morphology and function

Affiliations

4-D cardiac MR image analysis: left and right ventricular morphology and function

Honghai Zhang et al. IEEE Trans Med Imaging. 2010 Feb.

Abstract

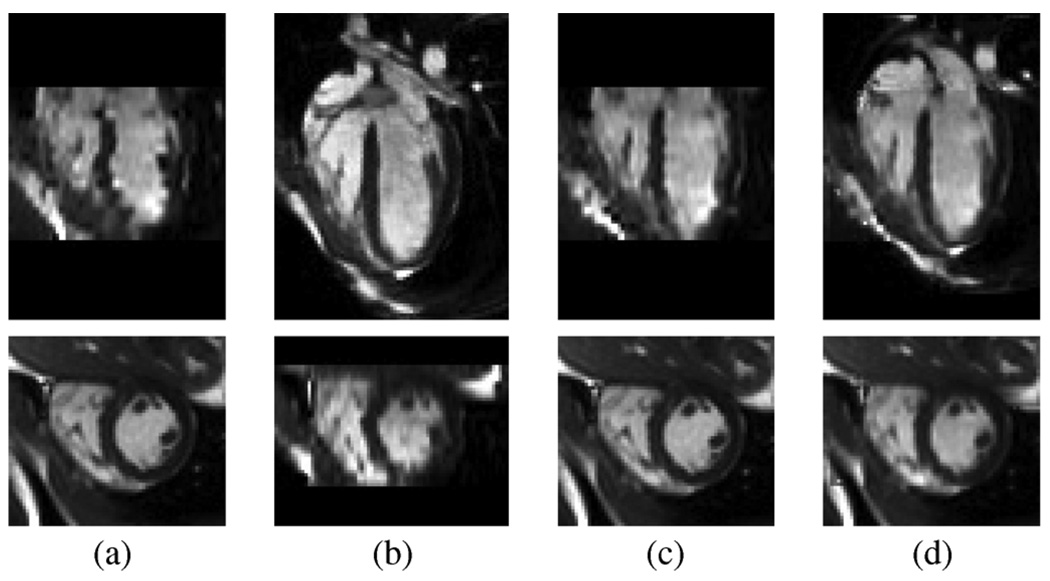
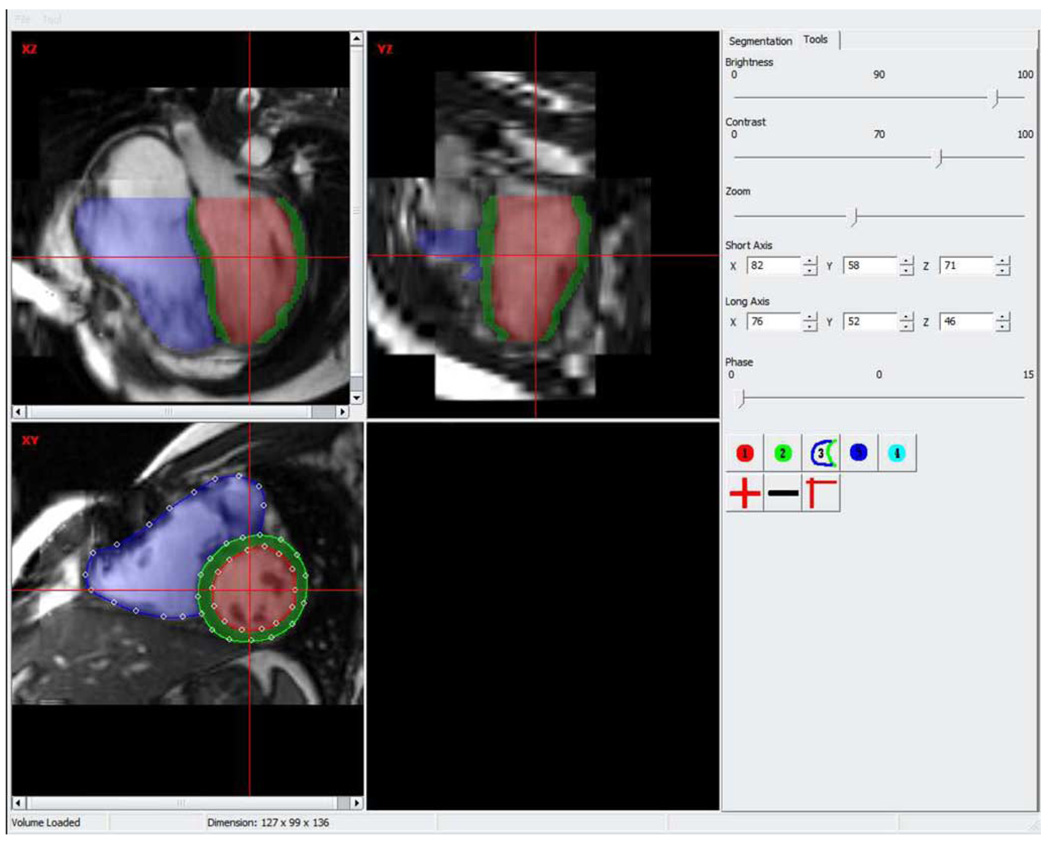
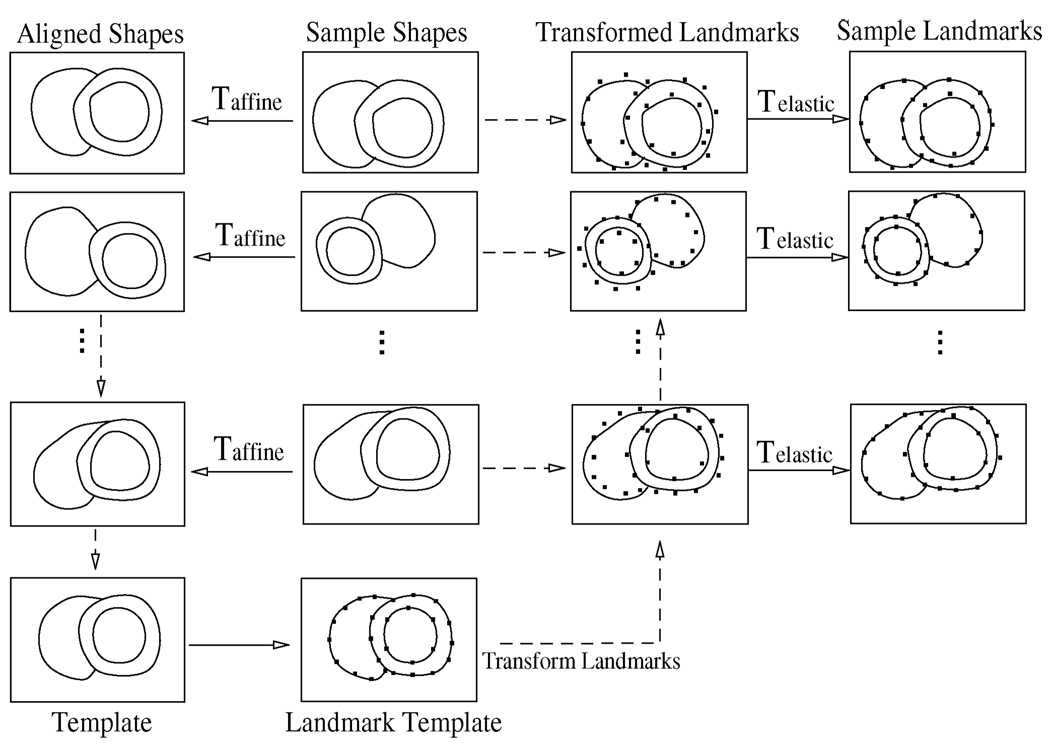
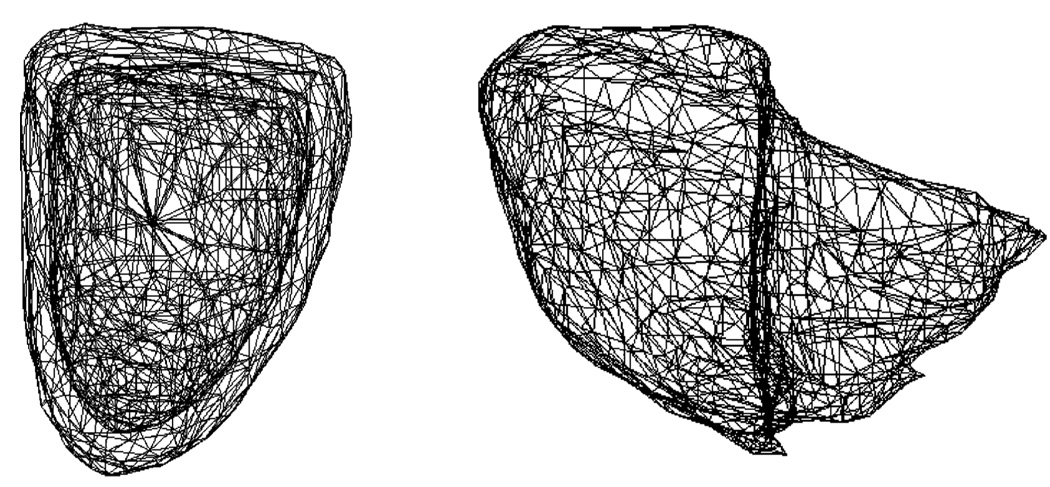
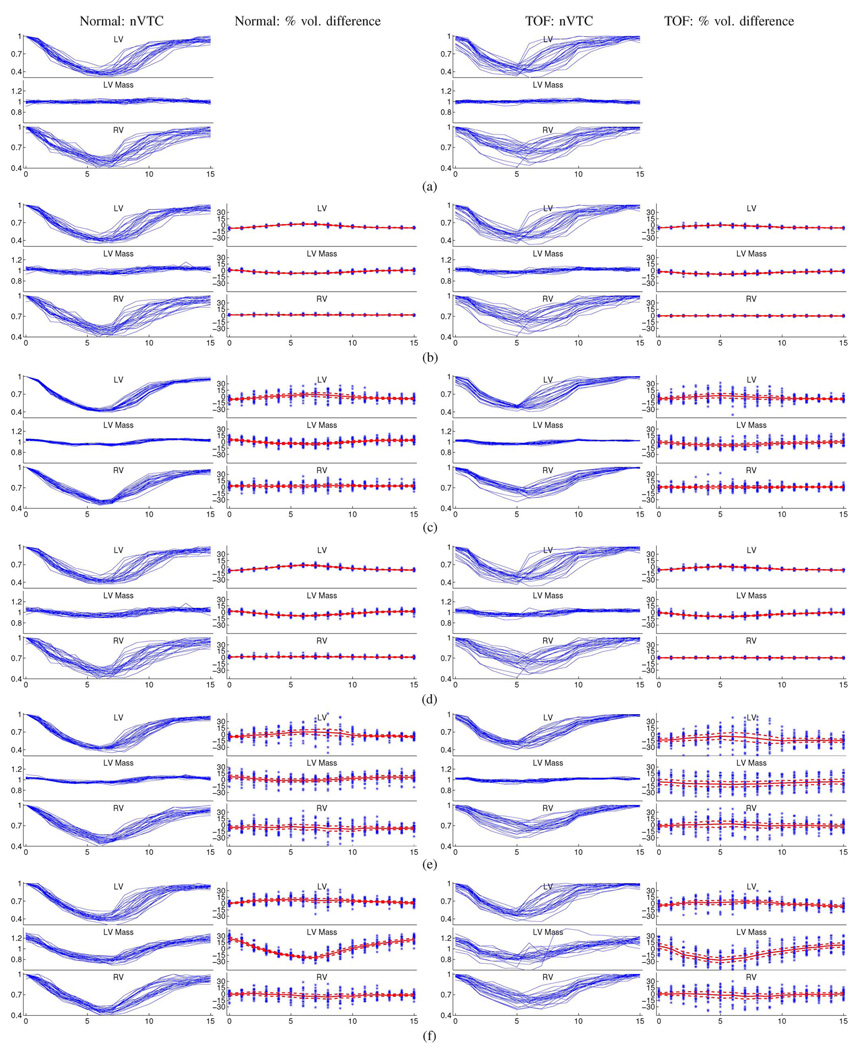
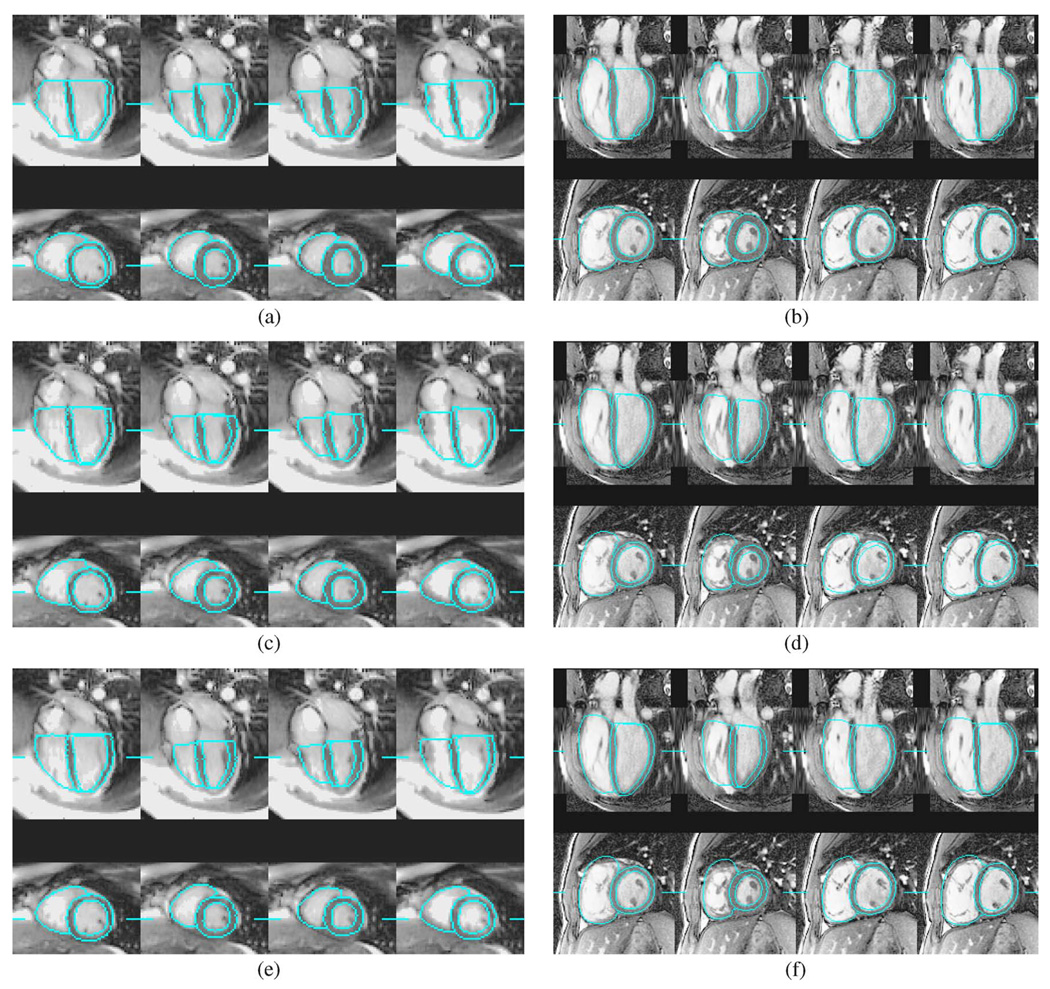
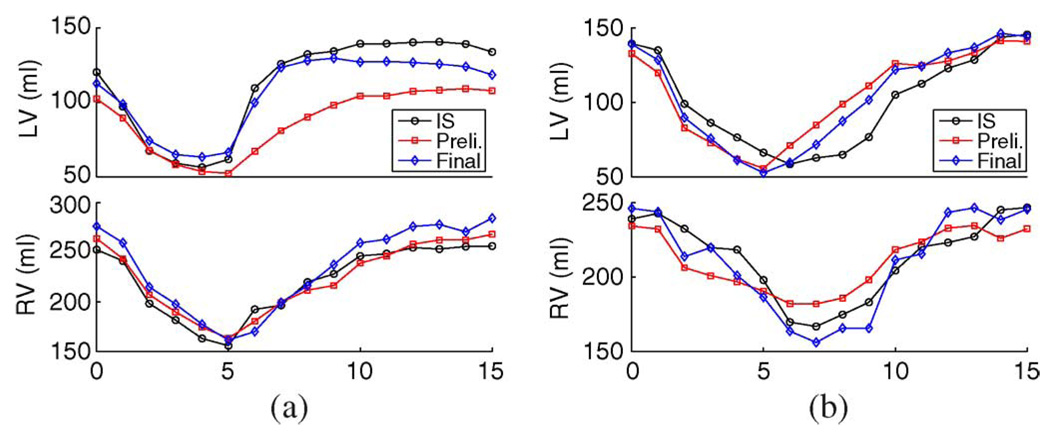
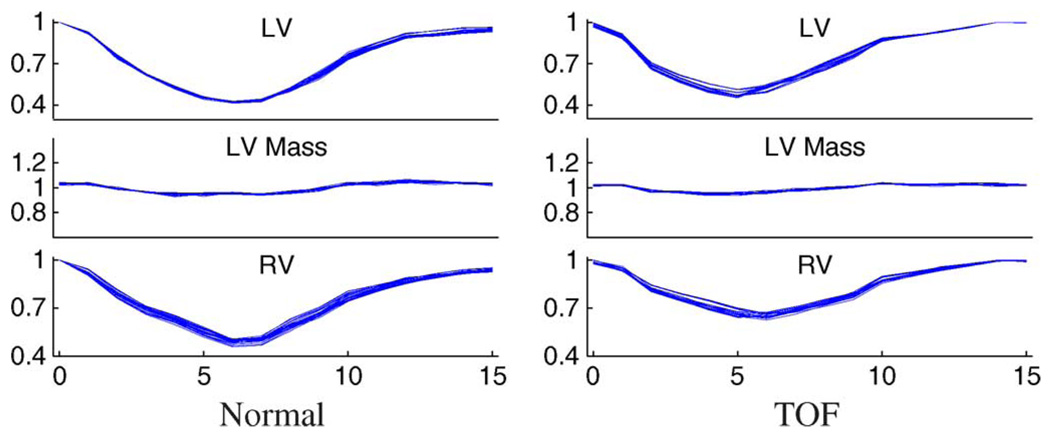
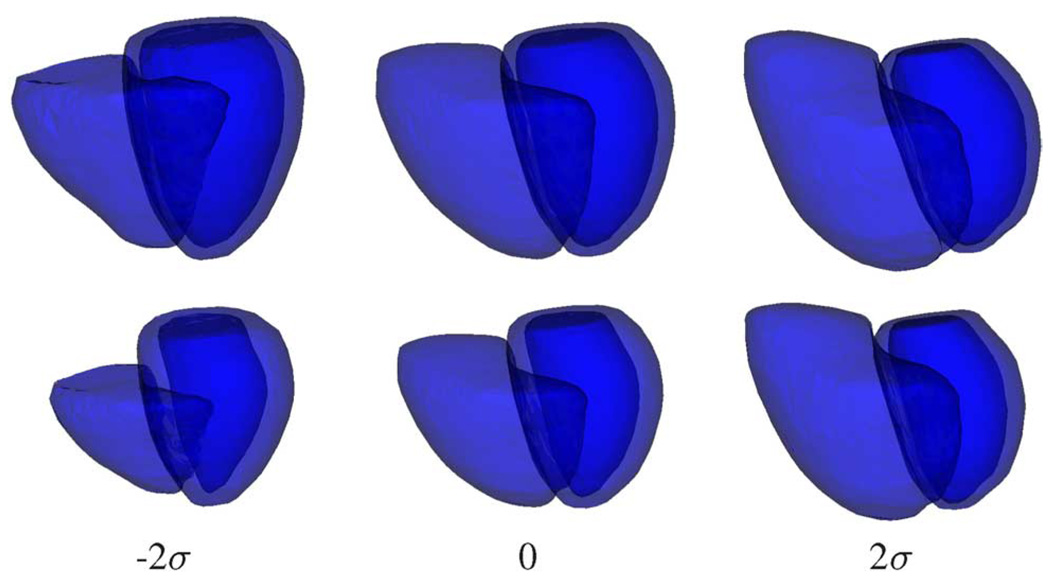
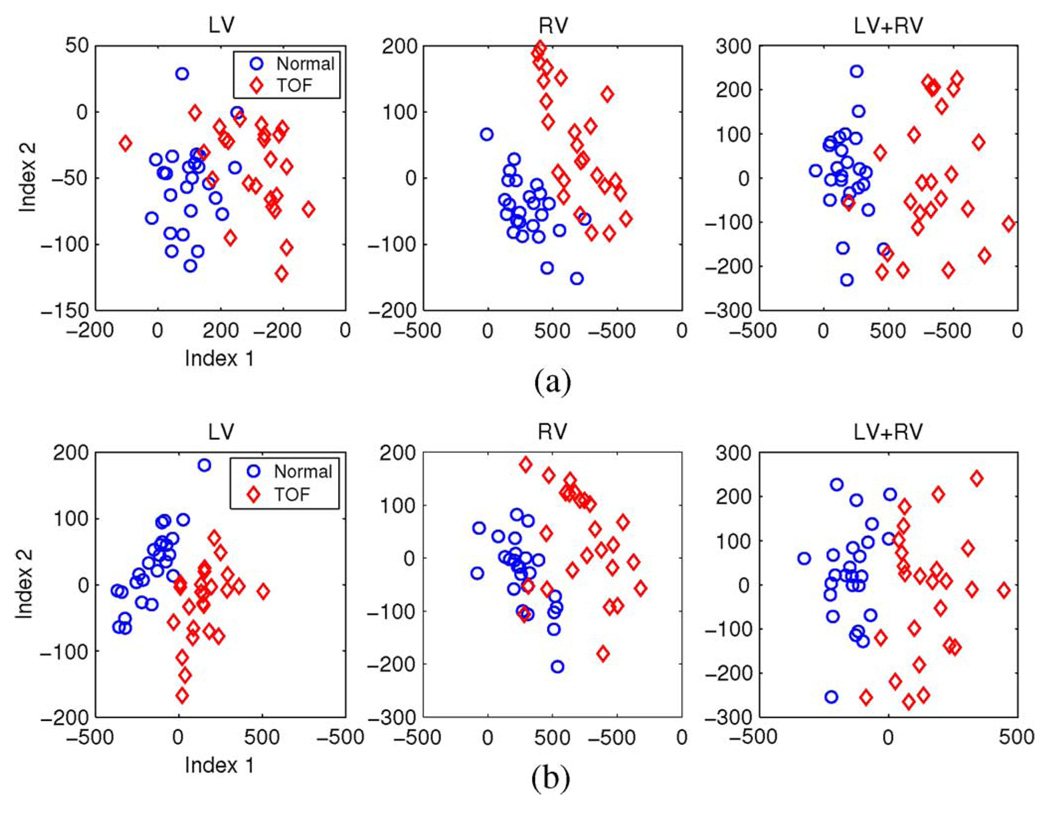
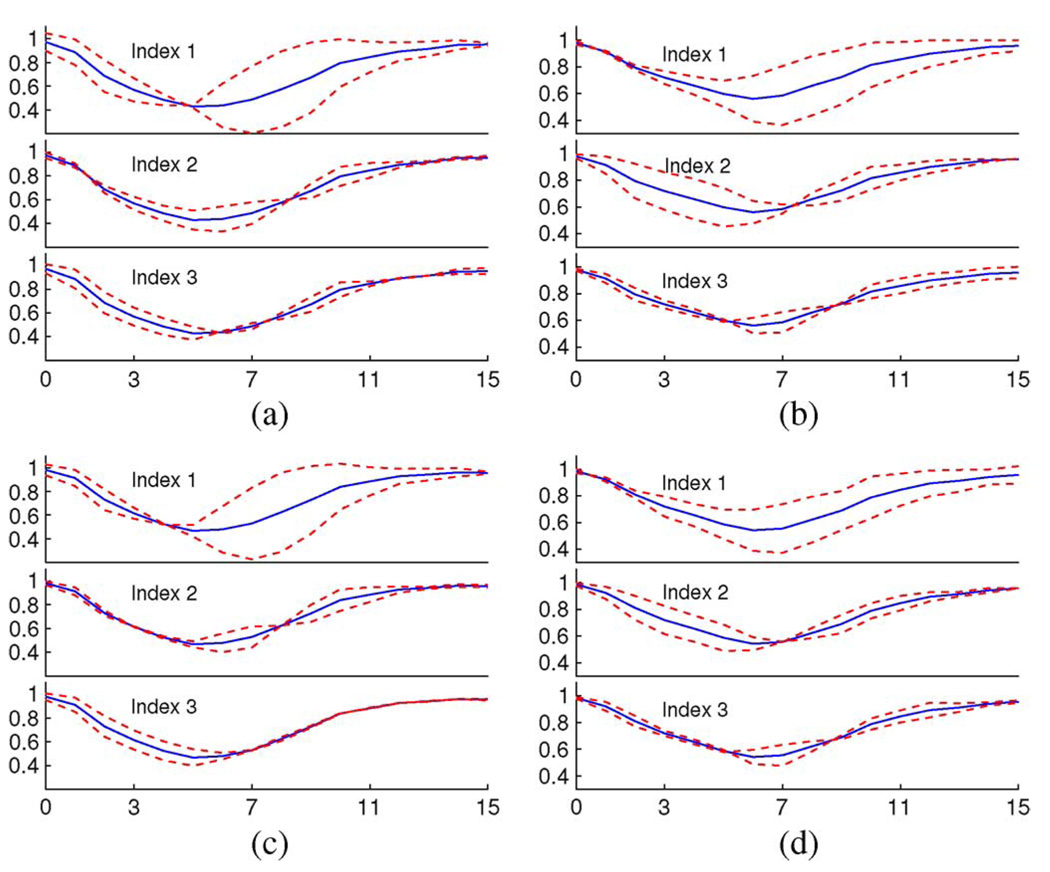
In this study, a combination of active shape model (ASM) and active appearance model (AAM) was used to segment the left and right ventricles of normal and Tetralogy of Fallot (TOF) hearts on 4-D (3-D+time) MR images. For each ventricle, a 4-D model was first used to achieve robust preliminary segmentation on all cardiac phases simultaneously and a 3-D model was then applied to each phase to improve local accuracy while maintaining the overall robustness of the 4-D segmentation. On 25 normal and 25 TOF hearts, in comparison to the expert traced independent standard, our comprehensive performance assessment showed subvoxel segmentation accuracy, high overlap ratios, good ventricular volume correlations, and small percent volume differences. Following 4-D segmentation, novel quantitative shape and motion features were extracted using shape information, volume-time and dV/dt curves, analyzed and used for disease status classification. Automated discrimination between normal/TOF subjects achieved 90%-100% sensitivity and specificity. The features obtained from TOF hearts show higher variability compared to normal subjects, suggesting their potential use as disease progression indicators. The abnormal shape and motion variations of the TOF hearts were accurately captured by both the segmentation and feature characterization.


Figures

Fig. 1
Fig. 1
Image fusion process illustrated by selected LA (top row) and SA (bottom row) slices of end-diastolic isotropic 3-D images reconstructed (a) from SA MR data before motion correction, (b) from LA MR data before motion correction, and (c) from motion-corrected SA MR data. (d) End-diastole of the final fused image; note the improved image consistency in both SA and LA panels.
Fig. 2
Fig. 2
Screen shot of the manual tracing application.
Fig. 3
Fig. 3
Flowchart of automated landmark generation.
Fig. 4
Fig. 4
Template landmark meshes of LV and RV.
Fig. 5
Fig. 5
Surface vertex pi and its associated neighboring vertices qj.
Fig. 6
Fig. 6
Motion tracking capability of each process stage are visualized by nVTCs of normal (column 1) and TOF (column 3) hearts and percent volume differences of normal (column 2) and TOF (column 4) hearts. The mean and mean ± σ curves are shown in percent volume difference plots. In each plot, shown from top to bottom are measurements for LV, LV mass, and RV; the horizontal axis depicts cardiac phases 0–15 representing the entire cardiac cycle.
Fig. 7
Fig. 7
Segmentation of a normal heart and a TOF heart at cardiac phases 0, 3, 7, and 11. The line segments mark the locations of slices. (a) Normal: independent standard. (b) TOF: independent standard; (c) normal: preliminary segmentation. (d) TOF: preliminary segmentation. (e) Normal: final segmentation. (f) TOF: final segmentation.
Fig. 8
Fig. 8
Examples of improved motion tracking in the final segmentation shown by volume curves of LV (top row) and RV (bottom row) of two TOF hearts. (IS: independent standard, Preli: preliminary segmentation.)
Fig. 9
Fig. 9
Distributions of nVTCs of preliminary segmentations without reversed ASM. In each plot, shown from top to bottom are curves for LV, LV mass, and RV; the horizontal axis depicts cardiac phases 0–15 representing the entire cardiac cycle.
Fig. 10
Fig. 10
Shape variations at phases 0 (top row) and 7 (bottom row) introduced by varying the first modal index of the LV+RV 4-D shape model derived from the independent standard. The values of the first modal index are: − 2σ, 0 (mean shape), and 2σ.
Fig. 11
Fig. 11
Distributions of the two strongest modal indices of 4-D shape models of (from left to right) LV, RV, and LV+RV combined derived from (a) the independent standard and (b) the final segmentation.
Fig. 12
Fig. 12
The nVTC variations associated with varying first three modal indices (showing from top to bottom) by ±2σ (dashed lines) and the mean nVTCs (solid lines) of models derived from the independent standard (IS) and final segmentation. (a) IS LV nVTC. (b) IS RV nVTC. (c) final seg. LV nVTC. (d) final seg. RV nVTC.

References

    1. Anderson RH, Tynan M. Tetralogy of Fallot—A centennial review. Int. J. Cardiol. 1988 Dec;vol. 21(no. 3):219–232. - PubMed
    1. Gatzoulis MA, Webb GD, Daubeney PEF. Diagnosis and Management of Adult Congenital Heart Disease. New York: Churchill Livingstone; 2003.
    1. Anderson RH, Weinberg PM. The clinical anatomy of tetralogy of Fallot. Cardiol. Young. 2005 Feb;vol. 15(no. 1):38–47. - PubMed
    1. Hoffman JIE, Kaplan S, Liberthson RR. Prevalence of congenital heart disease. Am. Heart J. 2004 Mar;vol. 147(no. 3):425–439. - PubMed
    1. Helbing WA, de Roos A. Clinical applications of cardiac magnetic resonance imaging after repair of tetralogy of Fallot. Pediatr. Cardiol. 2000;vol. 21(no. 1):70–79. - PubMed

Publication types