

Atazanavir pharmacokinetics in genetically determined CYP3A5 expressors versus non-expressors
- PMID: 19710077
- PMCID: PMC2760462
- DOI: 10.1093/jac/dkp317
Atazanavir pharmacokinetics in genetically determined CYP3A5 expressors versus non-expressors
Abstract
Objectives: The objective of this study was to compare atazanavir pharmacokinetics in genetically determined CYP3A5 expressors versus non-expressors.
Methods: HIV-negative adult volunteers were pre-screened for CYP3A5 *3, *6 and *7 polymorphisms and enrollment was balanced for CYP3A5 expressor status, gender and race (African-American versus non-African-American). Participants received atazanavir 400 mg daily for 7 days followed by atazanavir/ritonavir 300 mg/100 mg daily for 7 days with pharmacokinetic studies on days 7 and 14. Other measures collected were bilirubin, UGT1A1 *28, and ABCB1 1236C > T, 2677G > T/A and 3435C > T genotypes. Data analyses utilized least squares regression.
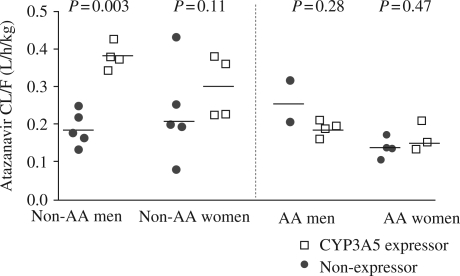
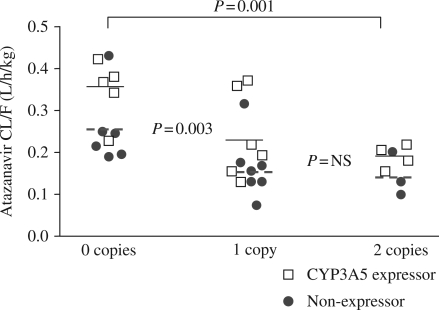
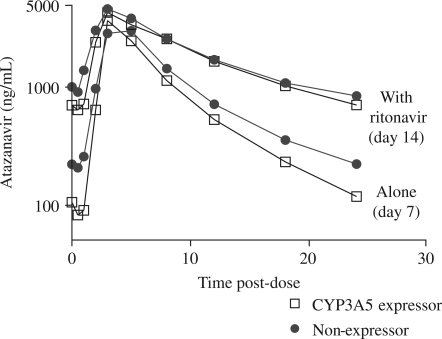
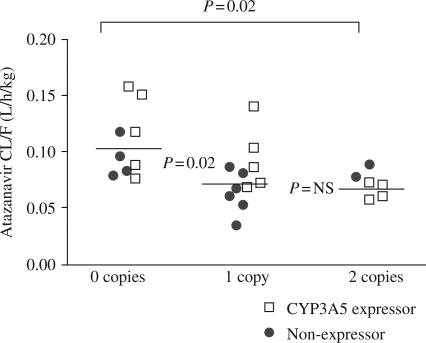
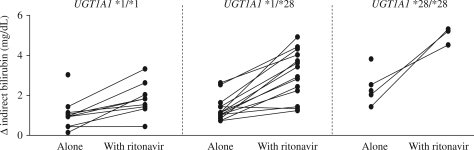
Results: Fifteen CYP3A5 expressors and 16 non-expressors participated. The day 7 atazanavir oral clearance (CL/F) was 1.39-fold faster (0.25 versus 0.18 L/h/kg; P = 0.045) and the C(min) was half (87 versus 171 ng/mL; P = 0.044) in CYP3A5 expressors versus non-expressors. Non-African-American CYP3A5 expressor males had 2.1-fold faster CL/F (P = 0.003) and <20% the C(min) (P = 0.0001) compared with non-African-American non-expressor males. No overall CYP3A5 expressor effects were observed during the ritonavir phase. One or two copies of wild-type ABCB1 haplotype (1236C/2677G/3435C) was predictive of slower atazanavir and ritonavir CL/F compared with zero copies (P < 0.06). Indirect bilirubin increased 1.6- to 2.8-fold more in subjects with UGT1A1 *28/*28 versus *1/*28 or *1/*1.
Conclusions: CYP3A5 expressors had faster atazanavir CL/F and lower C(min) than non-expressors. The effect was most pronounced in non-African-American men. Ritonavir lessened CYP3A5 expressor effects. The wild-type ABCB1 CGC haplotype was associated with slower CL/F and the UGT1A1 *28 genotype was associated with increased bilirubin. Thus, CYP3A5, ABCB1 and UGT1A1 polymorphisms are associated with atazanavir pharmacokinetics and pharmacodynamics in vivo.
Figures
References
-
- Panel on Antiretroviral Guidelines for Adults and Adolescents. Guidelines for the Use of Antiretroviral Agents in HIV-1-infected Adults and Adolescents. Department of Health and Human Services. 3 November 2008; 1–139. Available at: http://www.aidsinfo.nih.gov/ContentFiles/AdultandAdolescentGL.pdf. (30 April 2009, date last accessed)
-
- Acosta EP, Henry K, Baken L, et al. Indinavir concentrations and antiviral effect. Pharmacotherapy. 1999;19:708–12. - PubMed
-
- Havlir DV, O'Marro SD. Atazanavir: new option for treatment of HIV infection. Clin Infect Dis. 2004;38:1599–604. - PubMed
-
- Horberg M, Klein D, Hurley L, et al. Efficacy and safety of ritonavir-boosted and unboosted atazanavir among antiretroviral-naive patients. HIV Clin Trials. 2008;9:367–74. - PubMed
-
- Shafran SD, Mashinter LD, Roberts SE. The effect of low-dose ritonavir monotherapy on fasting serum lipid concentrations. HIV Med. 2005;6:421–5. - PubMed
Publication types
MeSH terms
Substances
Associated data
- Actions
Grants and funding
LinkOut - more resources
Full Text Sources
Medical
Molecular Biology Databases
