. 2009 Nov;83(21):11341-55.
doi: 10.1128/JVI.01440-09. Epub 2009 Aug 26.

Human immunodeficiency virus type 1 envelope gp120-induced partial T-cell receptor signaling creates an F-actin-depleted zone in the virological synapse

Affiliations

Human immunodeficiency virus type 1 envelope gp120-induced partial T-cell receptor signaling creates an F-actin-depleted zone in the virological synapse

Gaia Vasiliver-Shamis et al. J Virol. 2009 Nov.

Abstract

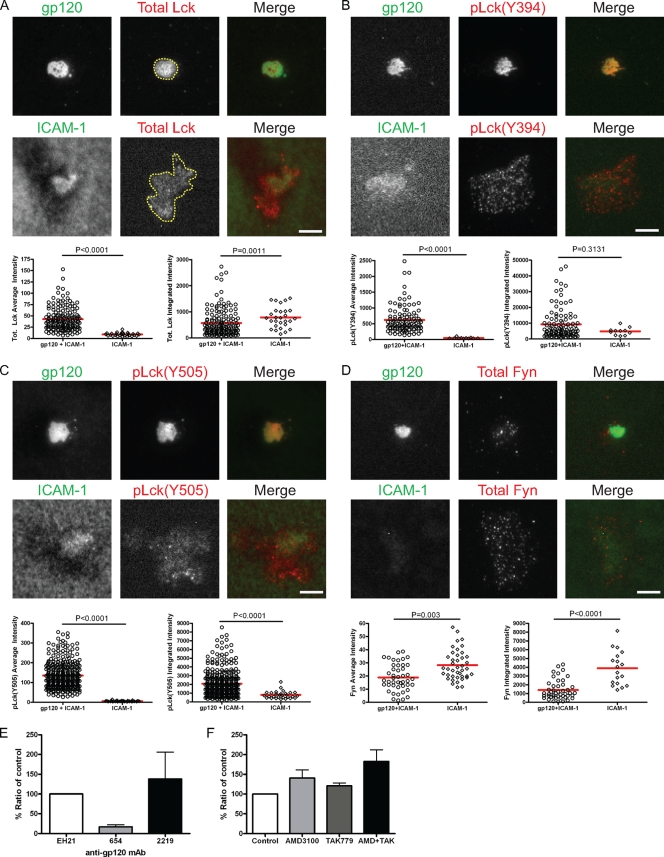
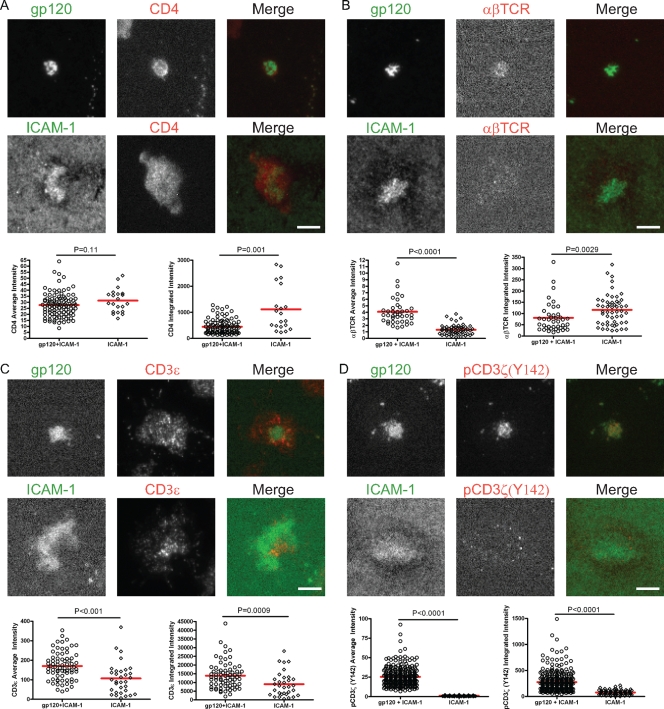
Cell-to-cell transmission of human immunodeficiency virus type 1 (HIV-1) occurs via a virological synapse (VS), a tight cell-cell junction formed between HIV-infected cells and target cells in which the HIV-1-infected cell polarizes and releases virions toward the noninfected target cell in a gp120- and intercellular adhesion molecule 1 (ICAM-1)-dependent process. The response of the target cell has been less studied. We utilized supported planar bilayers presenting gp120 and ICAM-1 as a reductionist model for the infected-cell membrane and investigated its effect on the target CD4 T cell. This study shows that HIV-1 gp120 interaction with its receptors is initially organized into microclusters that undergo F-actin-dependent consolidation into a central supramolecular activation complex (cSMAC). Src kinases are active in both gp120 microclusters and in the VS cSMAC. The early T-cell receptor (TCR) signaling machinery is partially activated at the VS, and signaling does not propagate to trigger Ca(2+) elevation or increase CD69 expression. However, these partial TCR signals act locally to create an F-actin-depleted zone. We propose a model in which the F-actin-depleted zone formed within the target CD4 T cell enhances the reception of virions by releasing the physical barrier for HIV-1 entry and facilitating postentry events.


Figures

FIG. 1.
FIG. 1.
HIV-1 gp120 MCs at the initiation of HIV-1 VS assembly. (A) Activated CD4 T cells were introduced onto gp120+ICAM-1 bilayers. The same fields were imaged continuously for 12 min. Representative images depicting gp120 MCs at the indicated times are shown. (B) Quantification of integrated and average fluorescence intensities ± standard errors of the means (error bars) of gp120 clusters over time. The average values from three independent experiments are shown. Twenty VSs were analyzed in each experiment. (C and D) Average fluorescence intensity of gp120 MCs (C) or VS cSMAC (D) as a function of size. Data shown are from one representative experiment out of three independent experiments. CD4 T cells were introduced onto gp120+ICAM-1 bilayers. (E and F) The same fields were imaged for 10 min (E) or 15 min (F). 1 μM latA was added at 2 min (E) or 10 min (F) (latA inj', latA injected). Representative images of one cell at designated time points before and after latA treatment are shown. Graphs showing average fluorescence intensities plus standard deviations (error bars) of gp120 MCs at the different time points are also shown next to the images in panels E and F. Data are from one representative experiment out of two independent experiments. Fifteen to twenty synapses were analyzed for each experiment. Bars = 5 μm.
FIG. 2.
FIG. 2.
Src phosphorylation associated with gp120 clustering. (A and B) Activated CD4 T cells were introduced onto gp120+ICAM-1 bilayers for 5 min (A) or 30 min (B) and then fixed and stained with a phospho-Src(Y416)-specific antibody. Representative images for the two different time points are shown. (C and D) Average and integrated intensities of pSrc(Y416) associated with the gp120 MCs at 5 min and with the cSMAC at 30 min. Data shown in panels C and D are from one out of two independent experiments. Bars = 5 μm.
FIG. 3.
FIG. 3.
Lck activation in the VS and its dependence on gp120-CD4 interaction. CD4 T cells were introduced onto bilayers containing gp120 and ICAM-1 or ICAM-1 alone for 45 min and then fixed and stained for total Lck (A), pLck(Y394) (B), pLck(Y505) (C), and total Fyn (D). Images of representative cells on the gp120+ICAM-1 bilayer (top panels) and the ICAM-1 bilayer (bottom panels) are shown. Fluorescence intensities of the individual cells were quantified within the areas marked with the yellow dashed lines in panel A. Quantification of average and integrated intensities detected by TIRFM are presented in the left and right graphs, respectively. A total of 30 to 350 cells were quantified for each condition. Comparable data were obtained from three independent experiments; data from one experiment are presented. Bars = 5 μm. (E) CD4 T cells were introduced onto gp120+ICAM-1 bilayers in the presence of an anti-gp120 MAb that blocks gp120-CD4 interaction (MAb 654), an anti-V3 MAb that interferes with gp120 interaction with the CKR (MAb 2219), or a control MAb to the N terminus of gp120 that does not affect gp120 binding to its receptors (MAb EH21). The MAbs were used at 20 μg/ml. (F) CD4 T cells were pretreated with 10 μM of CKR antagonist AMD-3100 or TAK-779 or both and then introduced onto gp120+ICAM-1 bilayers in the presence of antagonists. Cells were fixed and stained for pLck(Y394). The average fluorescence intensity detected by TIRFM was measured and presented as a percentage of control plus standard error of the mean (error bar). Data shown in panels E and F are average values from three independent experiments.
FIG. 4.
FIG. 4.
CD4 localization and TCR-CD3 involvement in the VS. CD4 T cells interacted with gp120+ICAM-1 or ICAM-1 bilayers for 45 min and then were fixed and stained for CD4 (A), αβTCR (B), CD3ɛ (C), and pCD3ζ(Y142) (D). The top panels show images of representative cells on the gp120+ICAM-1 bilayer, and the bottom panels show images of representative cells on the ICAM-1 bilayer from one out of three independent experiments. Average and integrated fluorescence intensities acquired by TIRFM are plotted in the right and left graphs, respectively. A total of 30 to 300 cells were quantified for each condition. Bars = 5 μm.
FIG. 5.
FIG. 5.
Recruitment of TCR signaling machinery to the VS. CD4 T cells were allowed to interact with gp120+ICAM-1 or ICAM-1 bilayers for 45 min and then were fixed and stained with phospho-specific antibodies for pZAP70(Y319) (A), pLAT(Y191) (B), pSLP76(Y128) (C), and pPLCγ(Y783) (D). The top panels show a representative image of a cell on a gp120+ICAM-1 bilayer, and the bottom panels show a representative image of a cell on a ICAM-1 bilayer. Average and integrated fluorescence intensities acquired by TIRFM are depicted by the right and left graphs, respectively. A total of 30 to 200 cells were quantified for each condition. Data from one of three independent experiments with consistent results are shown.
FIG. 6.
FIG. 6.
Absence of canonical T-cell activation and incomplete prosurvival signals in the VS. (A) CD4 T cells were loaded with Ca2+-sensitive dye Fura-2, introduced onto gp120+ICAM-1 or ICAM-1 bilayers, and imaged for up to 70 min. The ratio of the fluorescence intensity at 340 nm/fluorescence intensity at 380 nm was measured. The time points of ionomycin and EGTA injections are indicated by red arrowheads. (B to D) CD4 T cells were introduced onto the bilayers, and after 45 min, they were fixed and stained for Itk (B), pAkt(T308) (C), and pAkt(S473) (D). The top panels show representative images of cells on the gp120+ICAM-1 bilayer, and the bottom panels show representative images of cells on the ICAM-1 bilayer. Average and integrated fluorescence intensities from the TIRF channel are plotted in the left and right graphs, respectively. A total of 40 to 120 cells were quantified for each condition. Consistent findings were obtained in three independent experiments, and data from one experiment are shown. Bars = 5 μm.
FIG. 7.
FIG. 7.
VS-induced cytoskeletal rearrangements. (A) CD4 T cells were introduced onto gp120+ICAM-1 layers for 30 min, fixed, and stained with Alexa Fluor 568-phalloidin to detect F-actin. Representative images of F-actin staining detected in the wide-field and TIRF channels are shown. The top panels show the actin patterns in target cells forming VS, while the bottom panels show the actin patterns in migratory cells. Data from one out of two independent experiments are shown. (B) Integrated fluorescence intensity of actin staining in the VS cSMAC versus pSMAC (n = 30 cells). (C) CD4 T cells were introduced onto gp120+ICAM-1 bilayers for 30 min, fixed, and stained for β-tubulin to detect MTOC. Representative images of MT staining as detected in the wide-field and TIRF channels are shown. The top, middle, and bottom panels show MTOC polarized to the VS cSMAC, nonpolarized MTOC in a target cell, and MTOC at the uropod of a migratory cell, respectively. (D) The percentages of cells plus standard errors of the means (error bars) displaying different MTOC orientations are depicted. A total of 100 cells were analyzed in each experiment. Bars = 5 μm.
FIG. 8.
FIG. 8.
Lck signaling is required for F-actin rearrangements in the VS. CD4 T cells were pretreated with the indicated concentrations of the Lck inhibitor or with DMSO (control) and then introduced onto gp120+ICAM-1 bilayers in the presence of the inhibitor. (A) After 30 min, the cells were fixed and stained with antibody specific for pLck(Y394). The fluorescence intensity detected by TIRFM was measured, and the average values plus standard deviations (error bars) are presented. Data from one out of two independent experiments are shown. Values that were significantly different (P < 0.0001) from the control values are indicated (*). (B and C) CD4 T cells pretreated with 2 μM of Lck inhibitor or DMSO only were introduced onto gp120+ICAM-1 bilayers for 30 min, fixed, and stained with Alexa Fluor 568-phalloidin to detect F-actin (B). Integrated fluorescence intensity of F-actin as detected by TIRFM was measured and calculated for gp120-positive area (C) and for the whole cell (D). Data from one out of three independent experiments are shown. Bar s= 5 μm.

Similar articles

Cited by

References

    1. Arthos, J., C. Cicala, E. Martinelli, K. Macleod, D. Van Ryk, D. Wei, Z. Xiao, T. D. Veenstra, T. P. Conrad, R. A. Lempicki, S. McLaughlin, M. Pascuccio, R. Gopaul, J. McNally, C. C. Cruz, N. Censoplano, E. Chung, K. N. Reitano, S. Kottilil, D. J. Goode, and A. S. Fauci. 2008. HIV-1 envelope protein binds to and signals through integrin alpha4beta7, the gut mucosal homing receptor for peripheral T cells. Nat. Immunol. 9:301-309. - PubMed
    1. Barda-Saad, M., A. Braiman, R. Titerence, S. C. Bunnell, V. A. Barr, and L. E. Samelson. 2005. Dynamic molecular interactions linking the T cell antigen receptor to the actin cytoskeleton. Nat. Immunol. 6:80-89. - PubMed
    1. Barrero-Villar, M., J. R. Cabrero, M. Gordon-Alonso, J. Barroso-Gonzalez, S. Alvarez-Losada, M. A. Munoz-Fernandez, F. Sanchez-Madrid, and A. Valenzuela-Fernandez. 2009. Moesin is required for HIV-1-induced CD4-CXCR4 interaction, F-actin redistribution, membrane fusion and viral infection in lymphocytes. J. Cell Sci. 122:103-113. - PubMed
    1. Berg, L. J., L. D. Finkelstein, J. A. Lucas, and P. L. Schwartzberg. 2005. Tec family kinases in T lymphocyte development and function. Annu. Rev. Immunol. 23:549-600. - PubMed
    1. Bhaskar, P. T., and N. Hay. 2007. The two TORCs and Akt. Dev. Cell 12:487-502. - PubMed

Publication types

MeSH terms