. 2009 Aug 26;29(34):10499-511.
doi: 10.1523/JNEUROSCI.1937-09.2009.

Multimodal integration in rostral fastigial nucleus provides an estimate of body movement

Affiliations

Multimodal integration in rostral fastigial nucleus provides an estimate of body movement

Jessica X Brooks et al. J Neurosci. .

Abstract

The ability to accurately control posture and perceive self-motion and spatial orientation requires knowledge of the motion of both the head and body. However, whereas the vestibular sensors and nuclei directly encode head motion, no sensors directly encode body motion. Instead, the convergence of vestibular and neck proprioceptive inputs during self-motion is generally believed to underlie the ability to compute body motion. Here, we provide evidence that the brain explicitly computes an internal estimate of body motion at the level of single cerebellar neurons. Neuronal responses were recorded from the rostral fastigial nucleus, the most medial of the deep cerebellar nuclei, during whole-body, body-under-head, and head-on-body rotations. We found that approximately half of the neurons encoded the motion of the body in space, whereas the other half encoded the motion of the head in space in a manner similar to neurons in the vestibular nuclei. Notably, neurons encoding body motion responded to both vestibular and proprioceptive stimulation (accordingly termed bimodal neurons). In contrast, neurons encoding head motion were sensitive only to vestibular inputs (accordingly termed unimodal neurons). Comparison of the proprioceptive and vestibular responses of bimodal neurons further revealed similar tuning in response to changes in head-on-body position. We propose that the similarity in nonlinear processing of vestibular and proprioceptive signals underlies the accurate computation of body motion. Furthermore, the same neurons that encode body motion (i.e., bimodal neurons) most likely encode vestibular signals in a body-referenced coordinate frame, since the integration of proprioceptive and vestibular information is required for both computations.


Figures
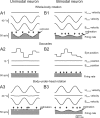
Figure 1.
Figure 1.
Characterization of rostral FN neuron types. Activity of example unimodal (left) and bimodal (right) neurons during basic paradigms. A1, B1, Neurons were identified by their response to horizontal head rotation during whole-body rotations. A2, B2, Static eye position sensitivity was studied by having the animal fixate laser targets moved in 5° steps. Only segments in which neither the head nor the eye moved were used for this analysis. A3, B3, Neck proprioceptor stimulation was applied by rotating the body under the head. Note that unimodal neurons are not modulated during this paradigm, whereas bimodal neurons show robust responses. Thick lines overlaying the firing rate represent a model based on estimated resting discharge and head (A1, B1) or body (A3, B3) velocity sensitivities. Vertical arrows show times that saccades occurred to highlight that there was no change in activity during vestibular quick phases.
Figure 2.
Figure 2.
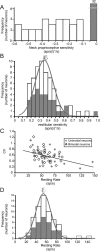
Distribution of neck proprioceptive and vestibular sensitivities and basic discharge parameters of rostral FN neurons. A, Distribution of neck proprioceptive sensitivities. Classification of neurons was done according to the sensitivity of their discharge to body-under-head rotation. Cells with no neck proprioception sensitivity [i.e., <0.1 (sp/s)/(°/s)] were classified as unimodal neurons (n = 32), whereas cells with a proprioception sensitivity >0.1 (sp/s)/(°/s) were classified as bimodal neurons (n = 31). B, Distribution of vestibular sensitivities determined during whole-body rotation. Gray and white arrows indicate the mean values for unimodal and bimodal neurons, respectively. C, Relationship between the coefficient of variation and the resting rate of unimodal neurons (filled diamonds) and bimodal neurons (empty diamonds). D, Distribution of resting discharge rate for the entire population. Gray and white arrows indicate the mean values for unimodal and bimodal neurons, respectively. All curves are fits for the whole neuronal population.
Figure 3.
Figure 3.
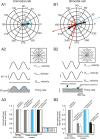
Combined vestibular–neck proprioceptive stimulation. Top, Polar plots of the vestibular (blue) and neck proprioceptive (red) sensitivities of unimodal (A1; n = 15) and bimodal (B1; n = 13) neurons, respectively. The length of the arrows indicates the sensitivity, and the angle represents the phase of the response. Superimposed black arrows are mean population vectors for vestibular and neck proprioceptive stimulation. Middle, Activity of example neurons (Fig. 1) during head-on-body rotations. Note that the unimodal neuron's activity (A2) could be predicted based on a summation of their neck proprioceptor and vestibular sensitivity (black line) or by its vestibular sensitivity alone (dashed blue line). In contrast, the modulation of the bimodal neuron (B2) was not well predicted based solely on its vestibular sensitivity (dashed blue line) but rather was better modeled by a prediction based on both its vestibular and neck proprioceptive sensitivities [black line; summation model (see Materials and Methods)]. Insets show polar plots of the vestibular and neck sensitivities as in A1 and B1 for the example neurons. Bottom, Histogram comparing sensitivities to vestibular and combined stimulation of type I (gray filled bars) and type II (gray empty bars) unimodal (A3) and bimodal (B3) neurons normalized to whole-body rotation sensitivity. For comparison, the predictions of the summation (black) and vestibular (blue) models are shown. Error bars represent ±SE.
Figure 4.
Figure 4.
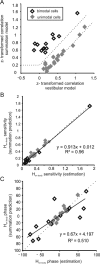
Predicting head-on-body responses based on responses during whole-body and body-under-head rotations. A, Scatter plots of z scores corresponding to the partial correlation coefficients for fits of each neuron's response with the vestibular and summation models (n = 28). The superimposed dashed lines show three regions: the upper left area corresponds to responses that were significantly better fit by the summation model, the lower right area includes neurons that were significantly better fit by the vestibular model, and an in-between area includes cells that were not significantly better fit by either model. B, Comparison of estimated and predicted sensitivities of unimodal (filled diamonds) and bimodal (empty diamonds) neurons to head-on-body rotations. The linear addition of vestibular and neck proprioceptor sensitivities provided a good prediction of each neuron's modulation during this paradigm. C, Comparison of the estimated and predicted phase of the response of unimodal and bimodal neurons during head-on-body rotations. Dotted lines are the unity line and the solid lines are the regression lines (B and C) fit through all data points.
Figure 5.
Figure 5.
Vestibular sensitivity tuning in response to static head-on-body position changes. Top, Tuning curves for two bimodal neurons (A, B) and one unimodal neuron (C). Vestibular sensitivity was measured during whole-body rotation with the head oriented at different positions relative to the body (shown in insets). Note that bimodal neurons, but not unimodal neurons, show changes in response at different head-on-body positions. Bottom, Distributions of the widths (D), amplitudes (E), and means (F) of turning curves (respectively) for unimodal (filled bars; n = 12) and bimodal (empty bars; n = 10) neurons. The average widths and amplitudes of the tuning curves were significantly different for unimodal and bimodal neurons; however, the average means of the tuning curves were not different and were centered on 0°.
Figure 6.
Figure 6.
Neck proprioceptive sensitivity tuning in response to static head-on-body position changes. Top, Tuning curves for a bimodal neuron (A) and a unimodal neuron (B). Neck sensitivity was measured during body-under-head rotations with the head initially at various positions relative to the body (shown in insets). Curves were fit from one neuron's responses to rotations at different head-on-body positions. C, Average tuning curves for bimodal and unimodal neurons for different neck positions to vestibular and neck proprioceptive stimulation. Bottom, Scatter plots of amplitudes (D), means (E), and widths (F) of vestibular and neck stimulation tuning curves for bimodal neurons (n = 8).
Figure 7.
Figure 7.
Static neck position sensitivity. Top, Firing rate of the two example neurons (A1, B1; same neurons as those shown in Fig. 1) recorded with the head statically shifted to different positions relative to the body. Note that only time intervals during which the head and body are stable in space are displayed and so time is discontinuous between each vertical line. Bottom, Average firing rate of the bimodal (A2) and unimodal (B2) neurons at different positions (binned in 5° intervals) does not change with neck position; error bars represent ±SE.
Figure 8.
Figure 8.
Rostral FN neurons encode motion of the head or of the body. A, Comparison of sensitivities to head-on-body rotation and whole-body rotation for both unimodal (filled diamonds) and bimodal neurons (empty diamonds). In both these paradigms the head is moving relative to space. Note that all filled symbols (unimodal neurons) fall on the unity line (dotted line), suggesting that these neurons encode motion of the head. The black line shows the regression line fit through unimodal neuron data. B, Comparison of sensitivities to body-under-head rotation and whole-body rotation for both unimodal (filled diamonds) and bimodal (empty diamonds) neurons. In both these paradigms the body is moving relative to space. Note that all empty symbols (bimodal neurons) fall on the unity line (dotted line), suggesting that these neurons encode motion of the body. The black line shows the regression line fit through bimodal neuron data.
Figure 9.
Figure 9.
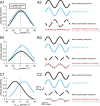
Bimodal neurons have tuning curves for vestibular and neck proprioceptive inputs that are similar. Left, Tuning curves for hypothetical bimodal neurons with neck-position-dependant responses to vestibular (blue curve) and neck (black curve) inputs that are similar (A1), have different amplitudes (B1), or have different mean values (C1). Right, Simulation of vestibular (blue line) and neck (black dashed line) responses as well as predicted combined response (summation prediction) to head-on-body stimulation with (red dotted line) and without (gray line) tuning related to head-on-body position of vestibular and neck inputs for the hypothetical neurons. Notice that modulation is similar when there is no tuning (red dashed line) and when there is tuning (gray line) when the tuning curves are similar (A2) but not when the tuning is dissimilar (B2, C2). (Summation prediction without tuning is calculated based on sensitivities at the 0° head-on-body position, denoted by the gray dashed line on the left of the figure).

References

    1. Anastasopoulos D, Mergner T. Canal-neck interaction in vestibular nuclear neurons of the cat. Exp Brain Res. 1982;46:269–280. - PubMed
    1. Andersen RA, Mountcastle VB. The influence of the angle of gaze upon the excitability of the light-sensitive neurons of the posterior parietal cortex. J Neurosci. 1983;3:532–548. - PMC - PubMed
    1. Angelaki DE, Shaikh AG, Green AM, Dickman JD. Neurons compute internal models of the physical laws of motion. Nature. 2004;430:560–564. - PubMed
    1. Asanuma C, Thach WT, Jones EG. Distribution of cerebellar terminations and their relation to other afferent terminations in the ventral lateral thalamic region of the monkey. Brain Res. 1983;286:237–265. - PubMed
    1. Avillac M, Denève S, Olivier E, Pouget A, Duhamel JR. Reference frames for representing visual and tactile locations in parietal cortex. Nat Neurosci. 2005;8:941–949. - PubMed

Publication types