. 2009 Aug 26;29(34):10588-99.
doi: 10.1523/JNEUROSCI.2323-09.2009.

Astrocytic dysfunction in epileptogenesis: consequence of altered potassium and glutamate homeostasis?

Affiliations

Astrocytic dysfunction in epileptogenesis: consequence of altered potassium and glutamate homeostasis?

Yaron David et al. J Neurosci. .

Abstract

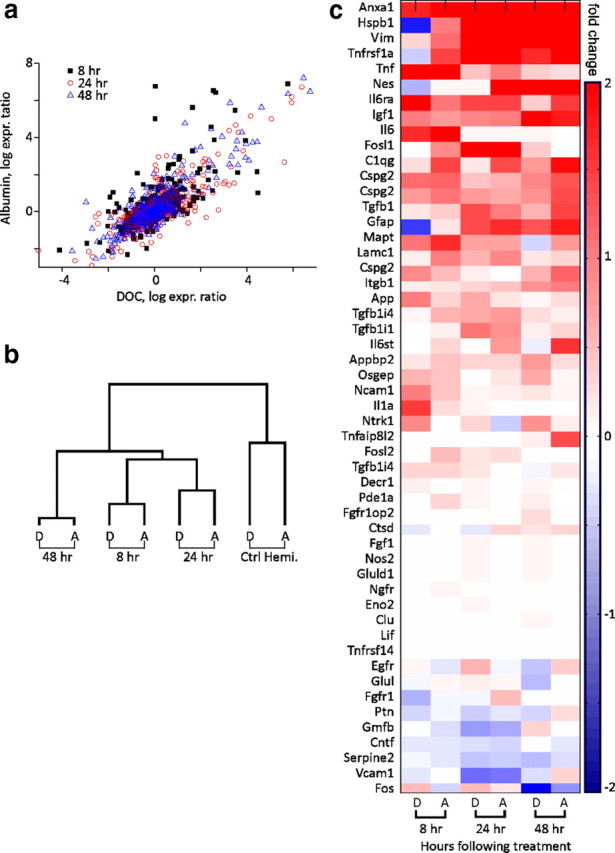
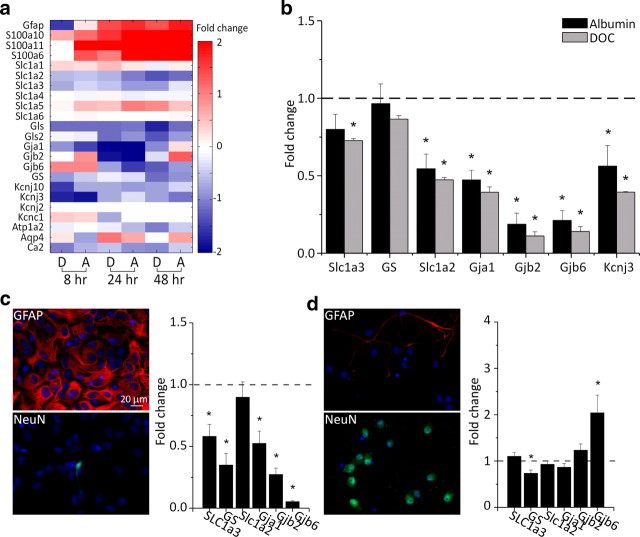
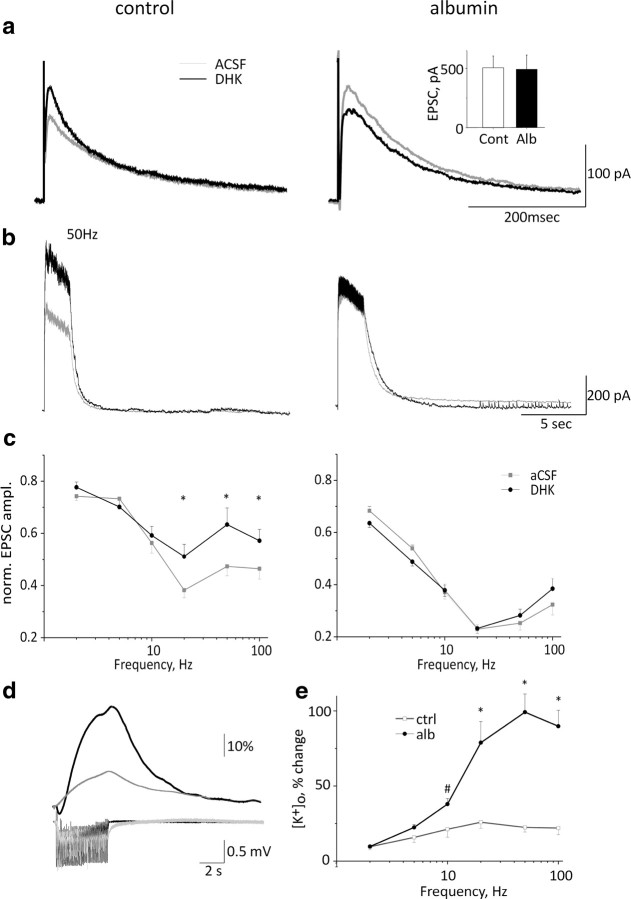
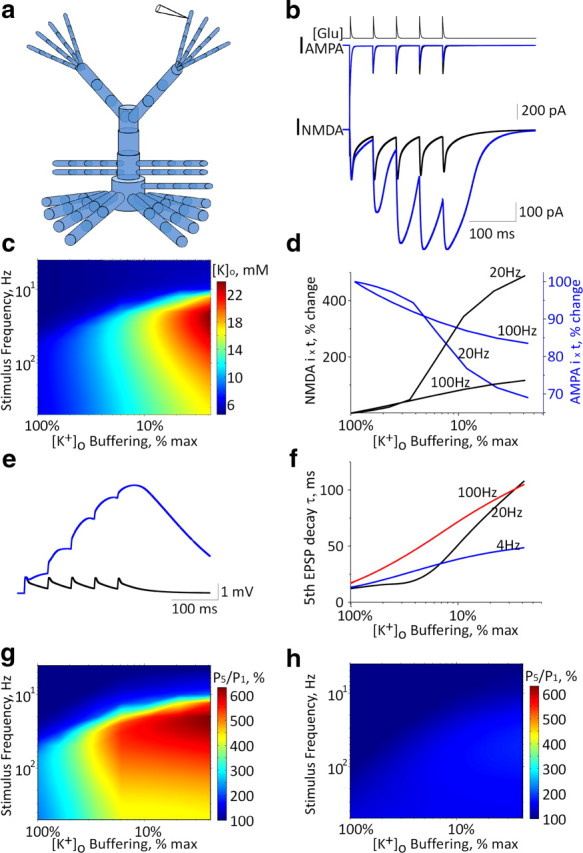
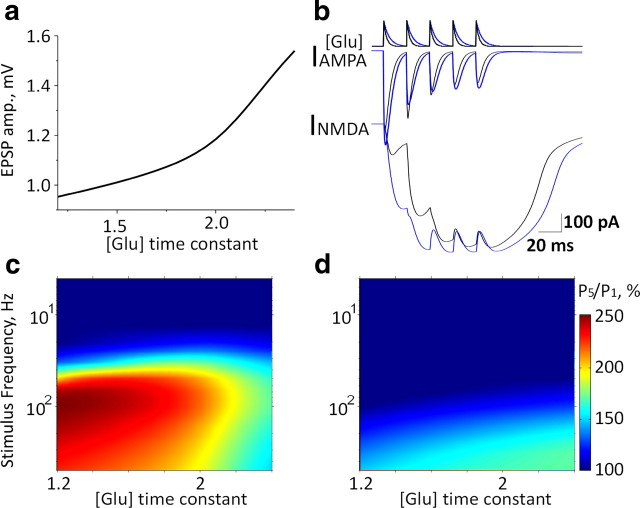
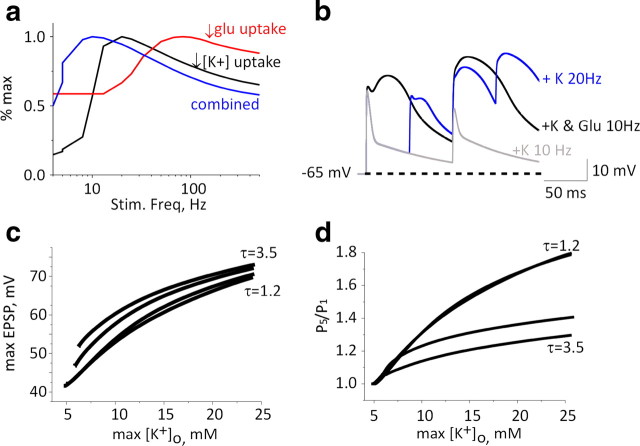
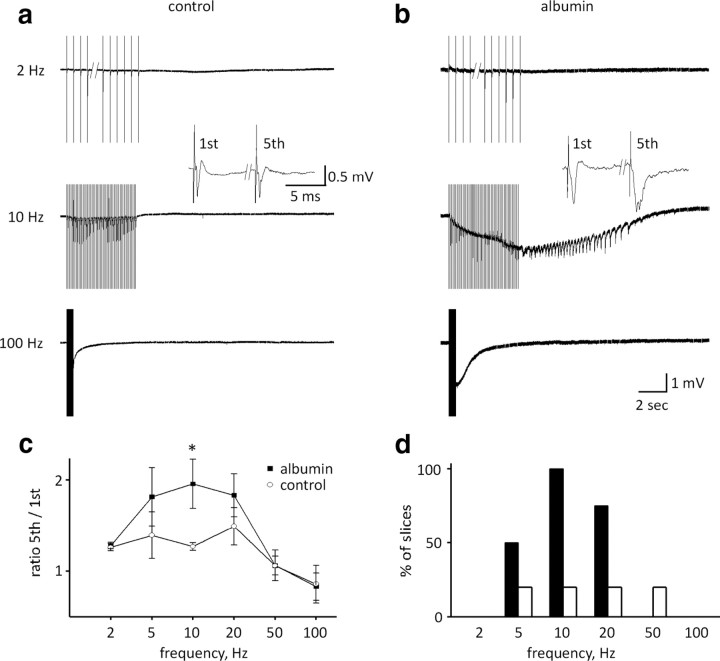
Focal epilepsy often develops following traumatic, ischemic, or infectious brain injury. While the electrical activity of the epileptic brain is well characterized, the mechanisms underlying epileptogenesis are poorly understood. We have recently shown that in the rat neocortex, long-lasting breakdown of the blood-brain barrier (BBB) or direct exposure of the neocortex to serum-derived albumin leads to rapid upregulation of the astrocytic marker GFAP (glial fibrillary acidic protein), followed by delayed (within 4-7 d) development of an epileptic focus. We investigated the role of astrocytes in epileptogenesis in the BBB-breakdown and albumin models of epileptogenesis. We found similar, robust changes in astrocytic gene expression in the neocortex within hours following treatment with deoxycholic acid (BBB breakdown) or albumin. These changes predict reduced clearance capacity for both extracellular glutamate and potassium. Electrophysiological recordings in vitro confirmed the reduced clearance of activity-dependent accumulation of both potassium and glutamate 24 h following exposure to albumin. We used a NEURON model to simulate the consequences of reduced astrocytic uptake of potassium and glutamate on EPSPs. The model predicted that the accumulation of glutamate is associated with frequency-dependent (>100 Hz) decreased facilitation of EPSPs, while potassium accumulation leads to frequency-dependent (10-50 Hz) and NMDA-dependent synaptic facilitation. In vitro electrophysiological recordings during epileptogenesis confirmed frequency-dependent synaptic facilitation leading to seizure-like activity. Our data indicate a transcription-mediated astrocytic transformation early during epileptogenesis. We suggest that the resulting reduction in the clearance of extracellular potassium underlies frequency-dependent neuronal hyperexcitability and network synchronization.


Figures

Figure 1.
Figure 1.
Transcriptional changes in astrocytes following exposure to albumin or BBB disruption. a, Sham-normalized expression levels of mRNA for genes preferentially expressed in astrocytes at 8, 24, and 48 h following treatment with the BBB disrupting agent DOC (D) or albumin (A). b, Hierarchical cluster analysis comparing astrocytic gene expression for DOC-treated and albumin-treated cortices at 8, 24, and 48 h following treatment, and the contralateral, nontreated hemisphere (Ctrl Hemi.). c, Average number of gene transcripts upregulated or downregulated by >150% grouped by cell type across all time points.
Figure 2.
Figure 2.
Alterations in astrocytic potassium- and glutamate-regulating genes. a, Sham-normalized mRNA expression levels for genes associated with K+ and glutamate homeostasis at 8, 24, and 48 h following in vivo treatment with DOC (D) and albumin (A). b, Sham-normalized mRNA expression levels for selected transcripts (see Results) obtained by real-time RT-PCR 24 h following DOC (gray bars) or albumin (black bars) treatments. c, Astrocyte-enriched cell cultures immunostained for GFAP (red) or NeuN (green). Nuclei visualized with DAPI staining (blue). The graph shows mRNA expression levels in albumin-exposed cultures compared with controls. d, Same as c, for neuron-enriched cultures. *p < 0.05.
Figure 3.
Figure 3.
Electrophysiological evidence for reduced glutamate and potassium buffering during epileptogenesis. a, Single NMDA-mediated EPSCs in control slices and 24 h following albumin treatment in vivo in ACSF (gray) and following DHK (black) application. Inset, Mean EPSC amplitude in ACSF. b, NMDA-mediated EPSCs during train stimulation at 50 Hz in control and treated animals. c, Mean evoked NMDA-mediated EPSC at different stimulation frequencies. d, [K+]o levels in control and treated slices during 20 Hz stimulation. e, Mean [K+]o levels during extracellular stimulation at 2–100 Hz (right). #p < 0.03, *p < 0.001 (n = 6 albumin-treated cells, 5 animals, n = 9 control cells, 7 animals).
Figure 4.
Figure 4.
Application of NEURON-based model to determine the effects of [K+]o accumulation. a, Schematic diagram of the modeled layer 2/3 pyramidal neuron containing 74 compartments with eight synapses (with AMPA and NMDA currents), one at each distal dendrite. b, Increasing glutamate levels at each of the eight synapses (top trace representing kinetics of synaptic glutamate level) elicits AMPA-mediated (middle trace) and NMDA-mediated (bottom trace) currents under control conditions (black) and under reduced astrocytic potassium clearance (under a 10-fold decrease of astrocytic K+ clearance, blue trace). c, Maximal K+ concentrations recorded in the vicinity of a distal dendritic compartment during repetitive stimulation as a function of [K+]o clearance and stimulation frequency. d, Percentage change of total charge transfer by NMDA (black) and AMPA (blue) receptors during stimulation at 20 and 100 Hz. e, Somatic EPSPs under control conditions (black) and under reduced astrocytic potassium clearance (10-fold reduction of control levels, blue trace). f, Fifth EPSP (elicited by stimulation at 4, 20, and 100 Hz) decay time constant at different levels of astrocytic potassium clearance rates. g, Ratio of fifth to first EPSP amplitude (P5/P1) at stimulation frequencies of 4–500 Hz at different levels of astrocytic potassium clearance rates. h, Same as in g with GNMDA = 0.
Figure 5.
Figure 5.
Application of NEURON-based model to determine the effects of glutamate accumulation. a, Somatic EPSP amplitudes for different glutamate time constants. b, Simultaneous glutamate “application” (kinetics represented in the upper trace) at each of the eight synapses elicits AMPA-mediated (middle) and NMDA-mediated (bottom) currents under control conditions (black) and a twofold increase in glutamate decay time constant (blue). c, Ratio of fifth to first EPSP amplitude (P5/P1) at different stimulation frequencies and varying glutamate decay time constants (values related to control). d, Same as in c with GNMDA = 0.
Figure 6.
Figure 6.
Modeling the concerted effect of reduced potassium and glutamate clearance. a, EPSP facilitation (relative to maximal value) for a 10-fold decrease in [K+]o clearance (black), a twofold slowing of glutamate decay time constant (red), and downregulation of both uptake mechanisms (blue) as a function of stimulation frequency. b, EPSP traces for 10 and 20 Hz trains under a 10-fold decrease in astrocytic K+ clearance (gray and blue traces, respectively) and with both uptake mechanisms downregulated (at 10 Hz, black). The dashed line marks the resting potential. c, Maximal EPSP amplitude elicited by a train of five stimuli as a function of maximal [K+]o for different glutamate uptake decay time constants (for 1.2, 2.2, 3.2, and 3.5 ms). d, EPSP facilitation [ratio of fifth to first EPSP amplitude (P5/P1)] for 20 Hz stimulation for different glutamate decay time constants (as in c).
Figure 7.
Figure 7.
Recording in vitro shows frequency-dependent increased neuronal excitability and hypersynchronous network activity during albumin-mediated epileptogenesis. a, b, Neocortical field potential recordings of brain slices during stimulation trains of 50 pulses at 2, 10, and 100 Hz. Field responses were facilitated in the albumin-treated slices, observed as increased duration of the population spikes (see inset in a, b). c, Comparison of the average field potential duration (at 1/3 maximal amplitude) for the fifth to the first evoked response reveals maximal facilitation at 10 Hz. d, Percentage of slices showing prolonged, paroxysmal discharges. *p < 0.05.

Similar articles

Cited by

References

    1. Abbott NJ, Rönnbäck L, Hansson E. Astrocyte-endothelial interactions at the blood-brain barrier. Nat Rev Neurosci. 2006;7:41–53. - PubMed
    1. Araque A, Carmignoto G, Haydon PG. Dynamic signaling between astrocytes and neurons. Annu Rev Physiol. 2001;63:795–813. - PubMed
    1. Arnth-Jensen N, Jabaudon D, Scanziani M. Cooperation between independent hippocampal synapses is controlled by glutamate uptake. Nat Neurosci. 2002;5:325–331. - PubMed
    1. Arriza JL, Fairman WA, Wadiche JI, Murdoch GH, Kavanaugh MP, Amara SG. Functional comparisons of three glutamate transporter subtypes cloned from human motor cortex. J Neurosci. 1994;14:5559–5569. - PMC - PubMed
    1. Barres BA, Chun LL, Corey DP. Ion channels in vertebrate glia. Annu Rev Neurosci. 1990;13:441–474. - PubMed

Publication types

MeSH terms